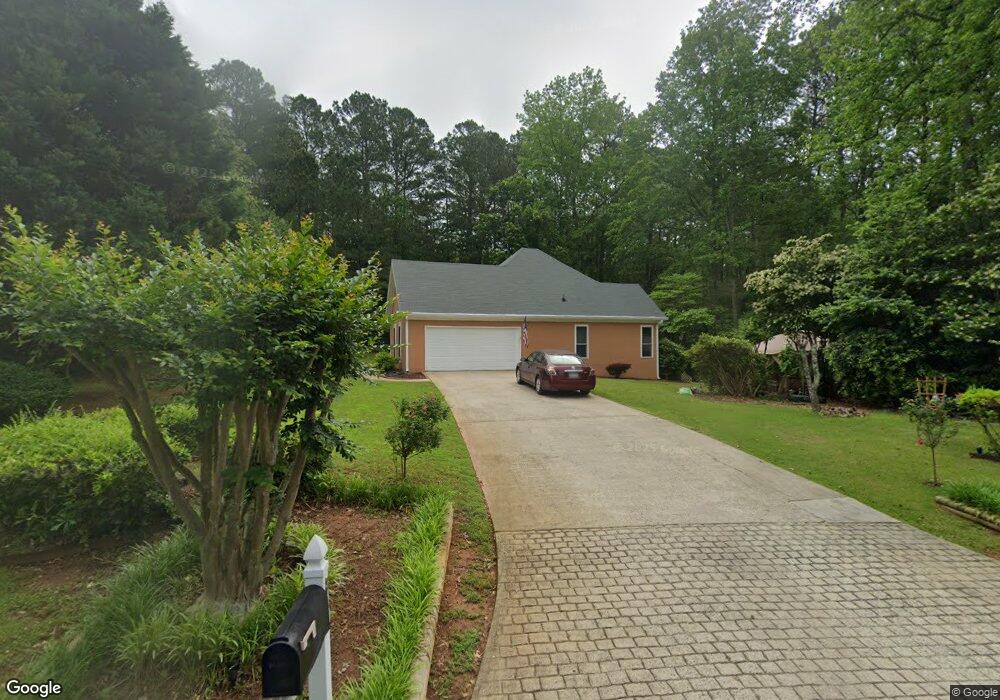
8 Ruisseau Turn Sharpsburg, GA 30277
Estimated Value: $381,443 - $449,000
3
Beds
2
Baths
1,993
Sq Ft
$215/Sq Ft
Est. Value
About This Home
This home is located at 8 Ruisseau Turn, Sharpsburg, GA 30277 and is currently estimated at $427,611, approximately $214 per square foot. 8 Ruisseau Turn is a home located in Coweta County with nearby schools including Canongate Elementary School, Madras Middle School, and Northgate High School.
Ownership History
Date
Name
Owned For
Owner Type
Purchase Details
Closed on
Jul 7, 2014
Sold by
Bachelor Tirena Ann
Bought by
Bachelor Michael Anthony
Current Estimated Value
Purchase Details
Closed on
Dec 19, 2008
Sold by
Bachelor Michael
Bought by
Bachelor Michael and Tirena Bachelor
Purchase Details
Closed on
Oct 17, 2008
Sold by
Walraven Thomas W
Bought by
Batchelor Michael
Purchase Details
Closed on
Oct 5, 1992
Bought by
Wilkerson Herbert T
Purchase Details
Closed on
Jul 15, 1992
Bought by
Pelletier Properties
Purchase Details
Closed on
Sep 10, 1991
Bought by
Frenchy Community De
Purchase Details
Closed on
Nov 30, 1979
Bought by
Braunsroth Douglas D
Create a Home Valuation Report for This Property
The Home Valuation Report is an in-depth analysis detailing your home's value as well as a comparison with similar homes in the area
Home Values in the Area
Average Home Value in this Area
Purchase History
| Date | Buyer | Sale Price | Title Company |
|---|---|---|---|
| Bachelor Michael Anthony | -- | -- | |
| Bachelor Michael | -- | -- | |
| Batchelor Michael | $205,000 | -- | |
| Wilkerson Herbert T | $102,400 | -- | |
| Pelletier Properties | $50,000 | -- | |
| Frenchy Community De | $374,400 | -- | |
| Braunsroth Douglas D | $63,300 | -- |
Source: Public Records
Tax History Compared to Growth
Tax History
| Year | Tax Paid | Tax Assessment Tax Assessment Total Assessment is a certain percentage of the fair market value that is determined by local assessors to be the total taxable value of land and additions on the property. | Land | Improvement |
|---|---|---|---|---|
| 2025 | $3,320 | $143,339 | $28,000 | $115,339 |
| 2024 | $3,362 | $147,353 | $28,000 | $119,353 |
| 2023 | $3,362 | $141,464 | $20,000 | $121,464 |
| 2022 | $2,747 | $114,248 | $20,000 | $94,248 |
| 2021 | $2,279 | $89,412 | $20,000 | $69,412 |
| 2020 | $2,292 | $89,412 | $20,000 | $69,412 |
| 2019 | $2,338 | $83,039 | $12,000 | $71,039 |
| 2018 | $2,343 | $83,039 | $12,000 | $71,039 |
| 2017 | $2,111 | $75,175 | $12,000 | $63,175 |
| 2016 | $2,089 | $75,175 | $12,000 | $63,175 |
| 2015 | $1,863 | $68,359 | $12,000 | $56,359 |
| 2014 | $1,747 | $64,689 | $12,000 | $52,689 |
Source: Public Records
Map
Nearby Homes
- 2043 Fischer Rd
- 2039 Fischer Rd
- 319 Le Paradis Blvd
- 68 Timbercreek Estates Dr
- 131 Cannongate Cir
- 125 Cannongate Cir
- 10 Fisher Way
- 972 Raymond Hill Rd
- 851 Raymond Hill Rd
- 0 Maple Trail
- 207 River Park Dr
- 12 Race Point Way
- LOT 2 Raymond Hill Rd
- 136 Barrington Grange Dr
- 200 Barrington Grange Dr
- 259 Strathmore Dr Unit 3
- 55 Grange Ct
- 75 Tomahawk Dr
- 70 Priscilla Way
- 50 Barrington Grange Ct
- 15 Renee Cir Unit 19
- 15 Renee Cir
- 27 Renee Cir
- 17 Ruisseau Turn
- 79 Le Paradis Blvd
- 10 Petite Rue
- 21 Ruisseau Turn
- 95 Le Paradis Blvd
- 0 Renee Cir Unit 8174720
- 0 Renee Cir Unit 7098242
- 45 Renee Cir
- 8 Renee Cir
- 45 Renee Cir
- 30 Ruisseau Turn
- 107 Le Paradis Blvd
- 107 Le Paradis Blvd Unit 10
- 136 Le Paradis Blvd
- 34 Ruisseau Turn
- 7 Petite Rue
- 20 Petite Rue