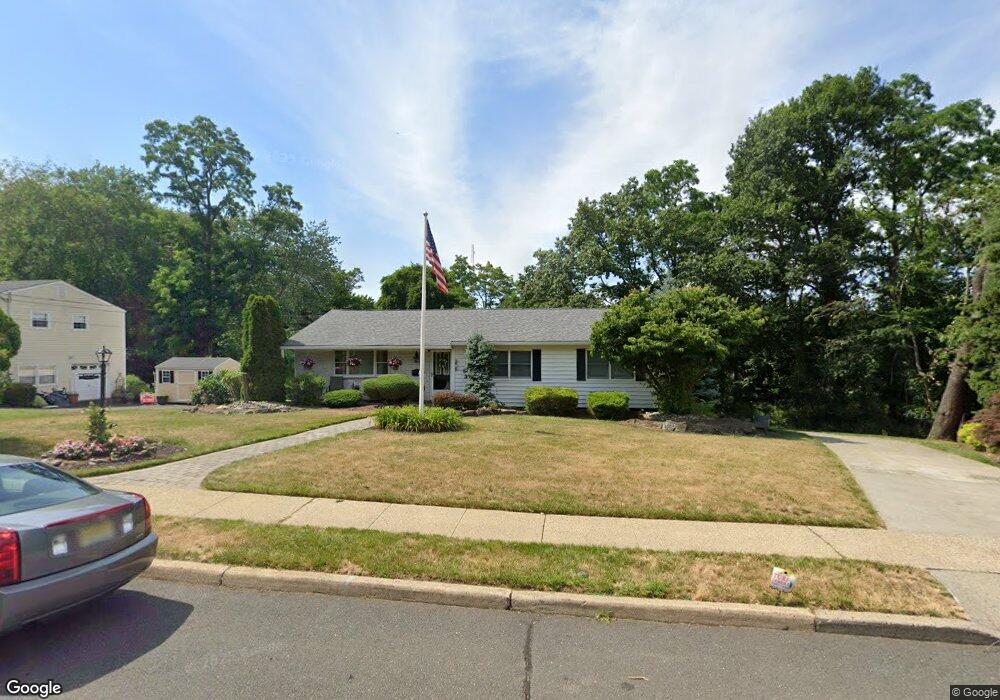
8 Ryers Ln Matawan, NJ 07747
Estimated Value: $536,000 - $645,876
3
Beds
2
Baths
1,464
Sq Ft
$405/Sq Ft
Est. Value
About This Home
This home is located at 8 Ryers Ln, Matawan, NJ 07747 and is currently estimated at $592,219, approximately $404 per square foot. 8 Ryers Ln is a home located in Monmouth County with nearby schools including Matawan Reg High School, Matawan Montessori Academy, and St Benedict School.
Ownership History
Date
Name
Owned For
Owner Type
Purchase Details
Closed on
Nov 8, 1993
Sold by
Federal Home Loan Mortgage Corporation
Bought by
Pettyjohn Marcus and Pettyjohn Caterinea
Current Estimated Value
Home Financials for this Owner
Home Financials are based on the most recent Mortgage that was taken out on this home.
Original Mortgage
$90,000
Interest Rate
7.11%
Purchase Details
Closed on
Jun 3, 1986
Bought by
Pettyjohn Marcus and Pettyjohn Caterina
Create a Home Valuation Report for This Property
The Home Valuation Report is an in-depth analysis detailing your home's value as well as a comparison with similar homes in the area
Home Values in the Area
Average Home Value in this Area
Purchase History
| Date | Buyer | Sale Price | Title Company |
|---|---|---|---|
| Pettyjohn Marcus | $125,000 | -- | |
| Pettyjohn Marcus | $138,000 | -- |
Source: Public Records
Mortgage History
| Date | Status | Borrower | Loan Amount |
|---|---|---|---|
| Previous Owner | Pettyjohn Marcus | $90,000 |
Source: Public Records
Tax History Compared to Growth
Tax History
| Year | Tax Paid | Tax Assessment Tax Assessment Total Assessment is a certain percentage of the fair market value that is determined by local assessors to be the total taxable value of land and additions on the property. | Land | Improvement |
|---|---|---|---|---|
| 2025 | $11,701 | $568,600 | $335,400 | $233,200 |
| 2024 | $11,392 | $536,000 | $350,400 | $185,600 |
| 2023 | $11,392 | $524,000 | $340,400 | $183,600 |
| 2022 | $10,082 | $437,300 | $262,400 | $174,900 |
| 2021 | $7,357 | $388,700 | $229,400 | $159,300 |
| 2020 | $10,224 | $373,700 | $219,400 | $154,300 |
| 2019 | $9,989 | $365,900 | $215,400 | $150,500 |
| 2018 | $9,962 | $359,000 | $210,400 | $148,600 |
| 2017 | $9,743 | $346,100 | $200,400 | $145,700 |
| 2016 | $9,348 | $339,200 | $195,400 | $143,800 |
| 2015 | $8,711 | $318,500 | $180,400 | $138,100 |
| 2014 | $8,674 | $318,300 | $175,400 | $142,900 |
Source: Public Records
Map
Nearby Homes