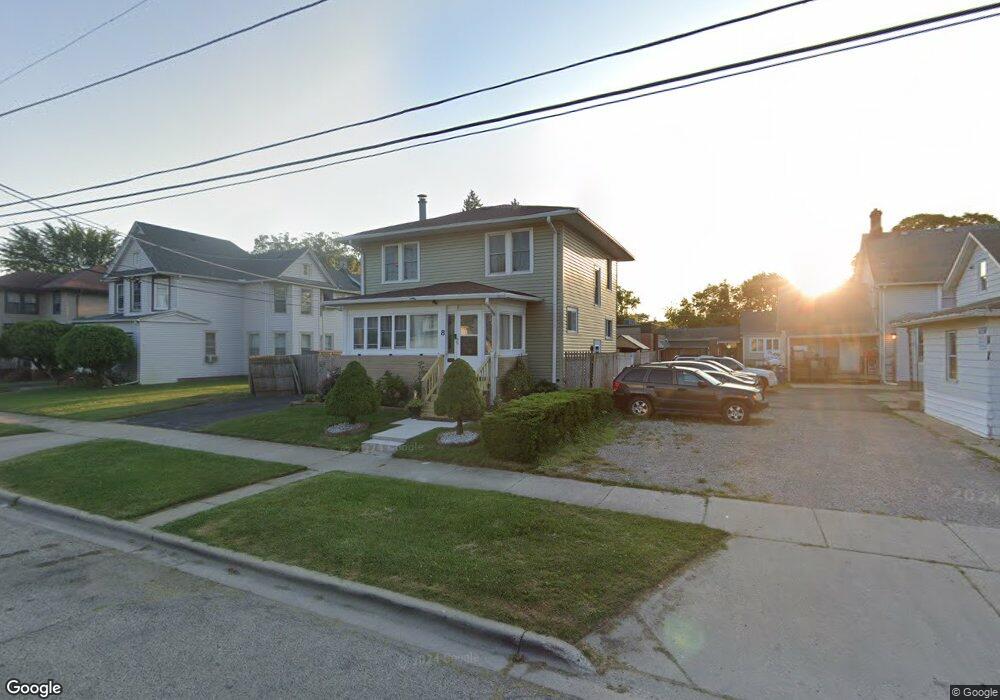
8 S Chapel St Waukegan, IL 60085
Downtown Waukegan NeighborhoodEstimated Value: $195,000 - $225,000
3
Beds
1
Bath
1,775
Sq Ft
$120/Sq Ft
Est. Value
About This Home
This home is located at 8 S Chapel St, Waukegan, IL 60085 and is currently estimated at $213,667, approximately $120 per square foot. 8 S Chapel St is a home located in Lake County with nearby schools including Robert E. Abbott Middle School, Waukegan High School, and Most Blessed Trinity Academy.
Ownership History
Date
Name
Owned For
Owner Type
Purchase Details
Closed on
Feb 5, 2009
Sold by
Us Bank National Association
Bought by
Soto Jose
Current Estimated Value
Home Financials for this Owner
Home Financials are based on the most recent Mortgage that was taken out on this home.
Original Mortgage
$56,949
Outstanding Balance
$35,979
Interest Rate
5.09%
Mortgage Type
FHA
Estimated Equity
$177,688
Purchase Details
Closed on
May 12, 2008
Sold by
Andino Miguel A and Andino Miguel Angel
Bought by
Us Bank Na and J P Morgan Mtg Acquisition Tr 2006-Cw2
Purchase Details
Closed on
Mar 23, 2006
Sold by
Johnson Judi A
Bought by
Padilla Jose Ruben and Andino Miguel A
Home Financials for this Owner
Home Financials are based on the most recent Mortgage that was taken out on this home.
Original Mortgage
$103,920
Interest Rate
8.6%
Mortgage Type
New Conventional
Create a Home Valuation Report for This Property
The Home Valuation Report is an in-depth analysis detailing your home's value as well as a comparison with similar homes in the area
Home Values in the Area
Average Home Value in this Area
Purchase History
| Date | Buyer | Sale Price | Title Company |
|---|---|---|---|
| Soto Jose | $58,000 | Forum Title Insurance Co | |
| Us Bank Na | -- | None Available | |
| Padilla Jose Ruben | $130,000 | Attorneys Title Guaranty Fun |
Source: Public Records
Mortgage History
| Date | Status | Borrower | Loan Amount |
|---|---|---|---|
| Open | Soto Jose | $56,949 | |
| Previous Owner | Padilla Jose Ruben | $103,920 |
Source: Public Records
Tax History Compared to Growth
Tax History
| Year | Tax Paid | Tax Assessment Tax Assessment Total Assessment is a certain percentage of the fair market value that is determined by local assessors to be the total taxable value of land and additions on the property. | Land | Improvement |
|---|---|---|---|---|
| 2024 | $3,019 | $46,722 | $4,515 | $42,207 |
| 2023 | $2,529 | $40,012 | $3,867 | $36,145 |
| 2022 | $2,529 | $31,866 | $3,143 | $28,723 |
| 2021 | $1,999 | $25,173 | $2,626 | $22,547 |
| 2020 | $1,978 | $23,451 | $2,446 | $21,005 |
| 2019 | $1,938 | $21,489 | $2,241 | $19,248 |
| 2018 | $1,850 | $20,687 | $2,775 | $17,912 |
| 2017 | $1,750 | $18,302 | $2,455 | $15,847 |
| 2016 | $1,530 | $15,903 | $2,133 | $13,770 |
| 2015 | $1,563 | $14,233 | $1,909 | $12,324 |
| 2014 | $2,160 | $18,302 | $1,918 | $16,384 |
| 2012 | $2,896 | $19,829 | $2,078 | $17,751 |
Source: Public Records
Map
Nearby Homes
- 613 Washington St
- 28 N Saint James St
- 557 W Water St
- 610 Bluff St
- 23 N Jackson St
- 215 S Park Ave
- 304 Powell Ave
- 613 Clarke Ave
- 305 Besley Place
- 408 Besley Place
- 502 Belvidere Rd
- 1416 Hamilton Ct
- 1521 Catalpa Ave
- 446 S Jackson St
- 426 Julian St
- 222 Grand Ave
- 428 N Poplar St
- 511 Chestnut St
- 452 North Ave
- 522 George Ave
- 14 S Chapel St
- 805 Washington St
- 18 S Chapel St
- 721 Washington St
- 22 S Chapel St
- 9 S Chapel St
- 15 S Chapel St
- 17 S Chapel St
- 819 Washington St
- 715 Washington St
- 19 S Chapel St
- 30 S Chapel St
- 23 S Chapel St
- 8 N Chapel St
- 711 Washington St
- 718 Washington St
- 709 Washington St
- 34 S Chapel St
- 714 Glen Rock Ave
- 714 Glen Rock Ave Unit 1