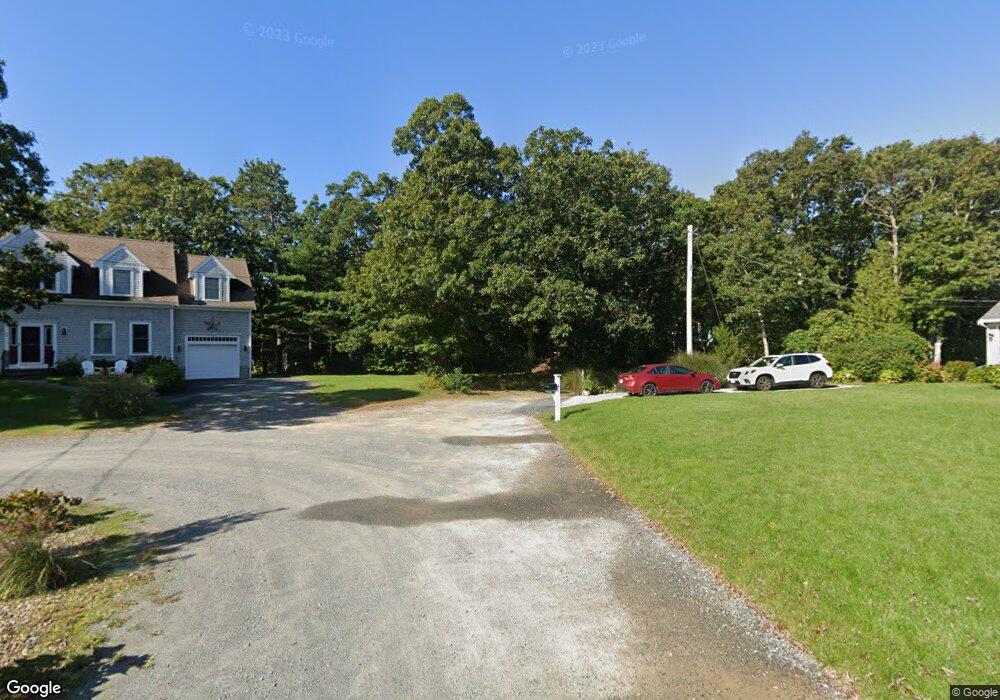
8 S West Dr Dennis, MA 02638
Dennis Village NeighborhoodEstimated Value: $587,000 - $662,000
3
Beds
2
Baths
1,176
Sq Ft
$533/Sq Ft
Est. Value
About This Home
This home is located at 8 S West Dr, Dennis, MA 02638 and is currently estimated at $626,635, approximately $532 per square foot. 8 S West Dr is a home located in Barnstable County with nearby schools including Dennis-Yarmouth Regional High School and St. Pius X. School.
Ownership History
Date
Name
Owned For
Owner Type
Purchase Details
Closed on
Feb 23, 2024
Sold by
Irina S Macphee Lt and Macphee
Bought by
John R Macphee 2022 T R and John Macphee
Current Estimated Value
Purchase Details
Closed on
Apr 27, 1990
Sold by
Butler Stephen F
Bought by
Richard Patricia A
Home Financials for this Owner
Home Financials are based on the most recent Mortgage that was taken out on this home.
Original Mortgage
$94,500
Interest Rate
10.26%
Mortgage Type
Purchase Money Mortgage
Create a Home Valuation Report for This Property
The Home Valuation Report is an in-depth analysis detailing your home's value as well as a comparison with similar homes in the area
Home Values in the Area
Average Home Value in this Area
Purchase History
| Date | Buyer | Sale Price | Title Company |
|---|---|---|---|
| John R Macphee 2022 T R | -- | None Available | |
| Richard Patricia A | $105,000 | -- | |
| Richard Patricia A | $105,000 | -- |
Source: Public Records
Mortgage History
| Date | Status | Borrower | Loan Amount |
|---|---|---|---|
| Previous Owner | Richard Patricia A | $85,300 | |
| Previous Owner | Richard Patricia A | $13,000 | |
| Previous Owner | Richard Patricia A | $6,980 | |
| Previous Owner | Richard Patricia A | $94,500 |
Source: Public Records
Tax History Compared to Growth
Tax History
| Year | Tax Paid | Tax Assessment Tax Assessment Total Assessment is a certain percentage of the fair market value that is determined by local assessors to be the total taxable value of land and additions on the property. | Land | Improvement |
|---|---|---|---|---|
| 2025 | $2,094 | $483,700 | $190,700 | $293,000 |
| 2024 | $2,040 | $464,600 | $192,200 | $272,400 |
| 2023 | $1,972 | $422,300 | $174,700 | $247,600 |
| 2022 | $1,832 | $327,200 | $143,100 | $184,100 |
| 2021 | $1,717 | $284,800 | $140,200 | $144,600 |
| 2020 | $1,686 | $276,400 | $140,200 | $136,200 |
| 2019 | $1,694 | $274,500 | $151,300 | $123,200 |
| 2018 | $1,577 | $248,700 | $130,900 | $117,800 |
| 2017 | $1,530 | $248,700 | $130,900 | $117,800 |
| 2016 | $1,710 | $261,900 | $163,600 | $98,300 |
| 2015 | $1,676 | $261,900 | $163,600 | $98,300 |
| 2014 | $1,436 | $226,100 | $130,900 | $95,200 |
Source: Public Records
Map
Nearby Homes
- 59 Main St Unit 19-2
- 59 Route 6a Unit 29-4
- 268 Main St
- 51 Bray Farm Rd N
- 6 Nimble Hill Dr
- 6 Thomas Ct
- 13 Covey Dr
- 15 Signal Hill Dr
- 35 Crown Grant Dr
- 42 John Hall Cartway Unit 42
- 64 Kates Path
- 50 John Hall Cartway
- 50 John Hall Cartway Unit 50
- 44 Stratford Ln
- 645 Main St Back Lot
- 4 Ebb Rd
- 11 Uncle Stanleys Way
- 111 Merchant Ave
- 34 Kates Path
- 34 Kates Path Unit 34