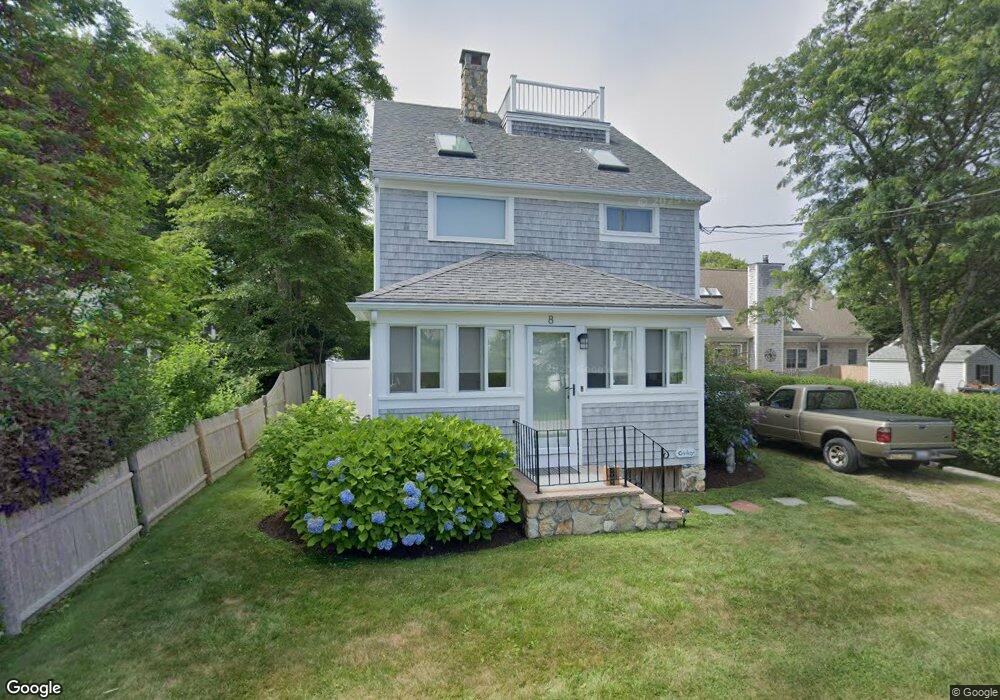
8 Sagamore Rd Mattapoisett, MA 02739
Estimated Value: $717,000 - $865,000
3
Beds
2
Baths
1,896
Sq Ft
$412/Sq Ft
Est. Value
About This Home
This home is located at 8 Sagamore Rd, Mattapoisett, MA 02739 and is currently estimated at $780,487, approximately $411 per square foot. 8 Sagamore Rd is a home located in Plymouth County with nearby schools including Center School, Old Hammondtown Elementary, and Old Rochester Regional High School.
Ownership History
Date
Name
Owned For
Owner Type
Purchase Details
Closed on
Nov 8, 2013
Sold by
Cristoforo Patricia M
Bought by
Conley Jeffrey M
Current Estimated Value
Purchase Details
Closed on
Jun 19, 2013
Sold by
Mary E Conley Lt and Conley
Bought by
Cristoforo Patricia M and Conley Jeffrey M
Purchase Details
Closed on
Jul 19, 2006
Sold by
Conley Mary E
Bought by
Mary E Conley Lt and Conley Jeffrey M
Create a Home Valuation Report for This Property
The Home Valuation Report is an in-depth analysis detailing your home's value as well as a comparison with similar homes in the area
Home Values in the Area
Average Home Value in this Area
Purchase History
| Date | Buyer | Sale Price | Title Company |
|---|---|---|---|
| Conley Jeffrey M | $155,000 | -- | |
| Conley Jeffrey M | $155,000 | -- | |
| Conley Jeffrey M | $155,000 | -- | |
| Cristoforo Patricia M | -- | -- | |
| Cristoforo Patricia M | -- | -- | |
| Mary E Conley Lt | -- | -- | |
| Mary E Conley Lt | -- | -- |
Source: Public Records
Tax History Compared to Growth
Tax History
| Year | Tax Paid | Tax Assessment Tax Assessment Total Assessment is a certain percentage of the fair market value that is determined by local assessors to be the total taxable value of land and additions on the property. | Land | Improvement |
|---|---|---|---|---|
| 2025 | $6,654 | $618,400 | $251,300 | $367,100 |
| 2024 | $6,382 | $607,200 | $251,300 | $355,900 |
| 2023 | $6,233 | $554,081 | $224,381 | $329,700 |
| 2022 | $5,989 | $482,984 | $186,984 | $296,000 |
| 2021 | $5,985 | $461,818 | $207,018 | $254,800 |
| 2020 | $5,359 | $397,250 | $178,050 | $219,200 |
| 2019 | $5,281 | $399,800 | $180,600 | $219,200 |
| 2018 | $5,255 | $403,600 | $196,800 | $206,800 |
| 2017 | $4,771 | $365,000 | $185,600 | $179,400 |
| 2016 | $4,818 | $365,000 | $185,600 | $179,400 |
| 2015 | $4,791 | $368,500 | $194,600 | $173,900 |
| 2014 | $4,628 | $363,800 | $185,700 | $178,100 |
Source: Public Records
Map
Nearby Homes
- 7 Mattakiset Rd
- 0 Harbor Acres Ln - Lot B
- 0 Marina Dr Unit 72497908
- 0 Marina Dr Unit 72497877
- 6 Meadowbrook Ln
- 41 Starboard Way
- 1 Starboard Way
- 28 Brandt Beach Ave
- 0 Whalers Way
- 15 Ned's Point Rd
- 6 Ocean Breeze Ln
- 1 Angelica Ave
- 7 Pearl St
- 11 Captains Ln
- 12 Cannon St
- 8 Captains Ln
- 3 Rock St
- 8 Channel St
- 0 (Lot D) Angelica Ave
- 35 North St
- 10 Sagamore Rd
- 3 Quansett St E
- 4 Sagamore Rd
- 7 King Phillip Rd
- 12 Sagamore Rd
- 3 Sagamore Rd
- 3 Sagamore Rd Unit WINTER
- 4 Seaconet Rd
- 2 Sagamore Rd
- 5 Sagamore Rd
- 9 King Phillip Rd
- 5 King Phillip Rd
- 8 Seaconet Rd
- 37 Seaconet Rd
- 11 King Phillip Rd
- 3 King Phillip Rd
- 14 Sagamore Rd
- 6 Mattakiset Rd
- 4 Mattakiset Rd
- 2 Seaconet Rd