Estimated Value: $83,000 - $125,000
--
Bed
1
Bath
1,147
Sq Ft
$94/Sq Ft
Est. Value
About This Home
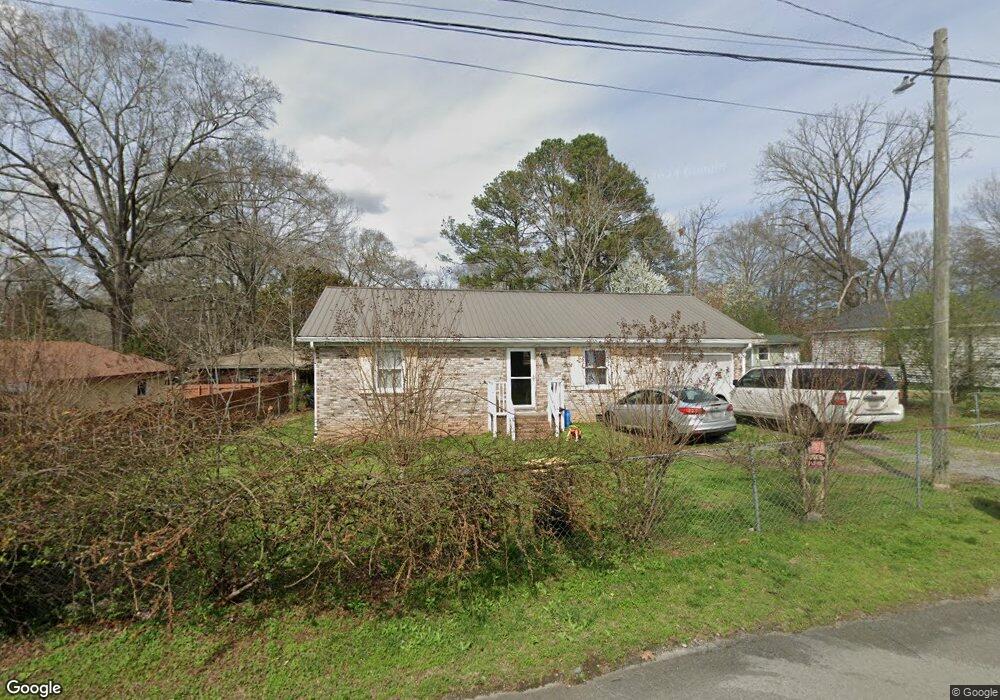
This home is located at 8 Sampson St NW, Rome, GA 30165 and is currently estimated at $107,577, approximately $93 per square foot. 8 Sampson St NW is a home located in Floyd County with nearby schools including Rome High School and St. Mary School.
Ownership History
Date
Name
Owned For
Owner Type
Purchase Details
Closed on
Jul 15, 2015
Sold by
Guillen David
Bought by
Guillen David and Guillen Martha G
Current Estimated Value
Home Financials for this Owner
Home Financials are based on the most recent Mortgage that was taken out on this home.
Original Mortgage
$32,526
Outstanding Balance
$12,094
Interest Rate
4.04%
Mortgage Type
New Conventional
Estimated Equity
$95,483
Purchase Details
Closed on
Apr 24, 2015
Sold by
P and R
Bought by
P and R
Purchase Details
Closed on
Jun 7, 2011
Sold by
Floyd County Tax
Bought by
Atkins Winford L
Purchase Details
Closed on
Mar 6, 1985
Sold by
Atkins Idalene
Bought by
Atkins Jimmy
Purchase Details
Closed on
Jul 24, 1981
Sold by
Atkins Jimmy L
Bought by
Atkins Idalene
Purchase Details
Closed on
Mar 28, 1980
Sold by
Atkins James C
Bought by
Atkins Jimmy L
Purchase Details
Closed on
Feb 20, 1980
Sold by
Chambers Harold H
Bought by
Atkins James C
Purchase Details
Closed on
Mar 10, 1970
Bought by
Chambers Harold H
Create a Home Valuation Report for This Property
The Home Valuation Report is an in-depth analysis detailing your home's value as well as a comparison with similar homes in the area
Home Values in the Area
Average Home Value in this Area
Purchase History
| Date | Buyer | Sale Price | Title Company |
|---|---|---|---|
| Guillen David | -- | -- | |
| Guillen David | $34,238 | -- | |
| P | -- | -- | |
| Atkins Winford L | $5,000 | -- | |
| Atkins Jimmy | -- | -- | |
| Atkins Idalene | $10,000 | -- | |
| Atkins Jimmy L | $1,000 | -- | |
| Atkins James C | $7,500 | -- | |
| Chambers Harold H | -- | -- |
Source: Public Records
Mortgage History
| Date | Status | Borrower | Loan Amount |
|---|---|---|---|
| Open | Guillen David | $32,526 | |
| Closed | Guillen David | $32,526 |
Source: Public Records
Tax History Compared to Growth
Tax History
| Year | Tax Paid | Tax Assessment Tax Assessment Total Assessment is a certain percentage of the fair market value that is determined by local assessors to be the total taxable value of land and additions on the property. | Land | Improvement |
|---|---|---|---|---|
| 2025 | $932 | $26,063 | $5,936 | $20,127 |
| 2024 | $932 | $24,006 | $5,396 | $18,610 |
| 2023 | $850 | $22,765 | $4,906 | $17,859 |
| 2022 | $816 | $22,374 | $3,924 | $18,450 |
| 2021 | $760 | $20,488 | $3,924 | $16,564 |
| 2020 | $699 | $18,678 | $3,066 | $15,612 |
| 2019 | $657 | $17,742 | $3,066 | $14,676 |
| 2018 | $622 | $16,791 | $3,066 | $13,725 |
| 2017 | $601 | $16,226 | $3,066 | $13,160 |
| 2016 | $509 | $15,744 | $3,040 | $12,704 |
| 2015 | $525 | $15,744 | $3,040 | $12,704 |
| 2014 | $525 | $15,744 | $3,040 | $12,704 |
Source: Public Records
Map
Nearby Homes
- 214 N Elm St NW
- 21 Sweetspire Dr NW
- 23 Sweetspire Dr NW
- 8 Leon St SW
- 40 Paris Dr SW
- 8 S Hughes St SW
- 17 N Haven Dr
- 207 Paris Dr SW
- 4 Silverbell Ln
- 8 Silverbell Ln
- 26 Jefferson Dr SW
- 728 Charlton St NW
- 311 Wilkerson Rd SW
- 0 Mount Alto Rd SW Unit 10523740
- 16 Jefferson Dr SW
- 313 Wilkerson Rd SW
- 207 Wilkerson Rd SW
- 720 Charlton St NW
- 0 Cedartown Rd Unit 10479932
- 19 Berckman Ln SW
- 4 Sampson St NW
- 102 Lamar St NW
- 104 Lamar St NW
- 108 Lamar St NW
- 15 N Sycamore St NW
- 17 N Sycamore St NW
- 19 N Sycamore St NW
- 110 Lamar St NW
- 101 Lamar St NW
- 103 Lamar St NW
- 21 N Sycamore St NW
- 9 Lamar St NW
- 29 N Sycamore St NW
- 7 Lamar St NW
- 107 Lamar St NW Unit 44-47
- 107 Lamar St NW
- N N Sycamore St
- 5 Lamar St NW
- 301 N Elm St NW
- 219 N Elm St NW