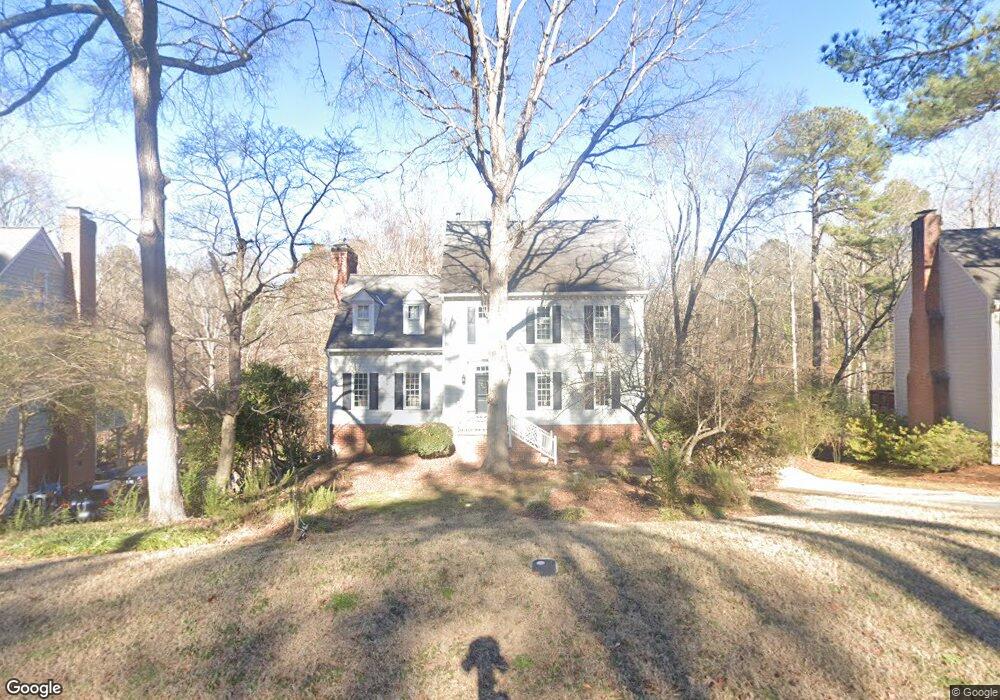
8 Sanderling Ct Durham, NC 27713
Woodcroft NeighborhoodEstimated Value: $605,000
5
Beds
4
Baths
3,520
Sq Ft
$172/Sq Ft
Est. Value
About This Home
This home is located at 8 Sanderling Ct, Durham, NC 27713 and is currently priced at $605,000, approximately $171 per square foot. 8 Sanderling Ct is a home located in Durham County with nearby schools including Southwest Elementary School, Morehead Montessori, and Sherwood Githens Middle.
Ownership History
Date
Name
Owned For
Owner Type
Purchase Details
Closed on
May 16, 2024
Sold by
Coxe Francis Field and Morrell Pamela Doane
Bought by
Biesma Jason and Biesma Anna S
Current Estimated Value
Purchase Details
Closed on
Aug 24, 2023
Sold by
Morrell Pamela Doane
Bought by
Woodcroft Community Association Inc
Purchase Details
Closed on
Oct 13, 2020
Sold by
Jackson Lisa Long and Jackson Wayne Eugene
Bought by
Morrell Pamela Doane
Purchase Details
Closed on
Jun 27, 2014
Sold by
Jackson Lisa Long
Bought by
Long Lisa and Jackson Lisa Long
Home Financials for this Owner
Home Financials are based on the most recent Mortgage that was taken out on this home.
Original Mortgage
$268,582
Interest Rate
4.19%
Mortgage Type
FHA
Purchase Details
Closed on
Apr 29, 2008
Sold by
Gotwals Kandace K
Bought by
Long Lisa
Home Financials for this Owner
Home Financials are based on the most recent Mortgage that was taken out on this home.
Original Mortgage
$291,406
Interest Rate
6.08%
Mortgage Type
FHA
Create a Home Valuation Report for This Property
The Home Valuation Report is an in-depth analysis detailing your home's value as well as a comparison with similar homes in the area
Home Values in the Area
Average Home Value in this Area
Purchase History
| Date | Buyer | Sale Price | Title Company |
|---|---|---|---|
| Biesma Jason | $604,000 | None Listed On Document | |
| Woodcroft Community Association Inc | -- | None Listed On Document | |
| Morrell Pamela Doane | $435,000 | None Available | |
| Long Lisa | -- | None Available | |
| Long Lisa | $319,000 | None Available |
Source: Public Records
Mortgage History
| Date | Status | Borrower | Loan Amount |
|---|---|---|---|
| Previous Owner | Long Lisa | $268,582 | |
| Previous Owner | Long Lisa | $291,406 |
Source: Public Records
Tax History
| Year | Tax Paid | Tax Assessment Tax Assessment Total Assessment is a certain percentage of the fair market value that is determined by local assessors to be the total taxable value of land and additions on the property. | Land | Improvement |
|---|---|---|---|---|
| 2023 | $5,176 | $395,170 | $64,552 | $330,618 |
| 2022 | $5,058 | $395,170 | $64,552 | $330,618 |
| 2021 | $5,034 | $395,170 | $64,552 | $330,618 |
| 2020 | $4,888 | $392,938 | $62,320 | $330,618 |
| 2019 | $4,888 | $392,938 | $62,320 | $330,618 |
| 2018 | $4,524 | $333,531 | $45,920 | $287,611 |
| 2017 | $4,491 | $333,531 | $45,920 | $287,611 |
| 2016 | $4,340 | $333,531 | $45,920 | $287,611 |
| 2015 | $4,160 | $300,513 | $49,450 | $251,063 |
| 2014 | $4,160 | $300,513 | $49,450 | $251,063 |
Source: Public Records
Map
Nearby Homes
- 4711 Highgate Dr
- 135 Long Shadow Place
- 4 Barkridge Ct
- 708 Sleepy Creek Dr
- 18 W Bridlewood Trail
- 3706 Chimney Ridge Place Unit 8
- 527 Woodwinds Dr
- 27 Falling Water Dr
- 10 Hickorywood Square
- 3805 Chimney Ridge Place Unit 104
- 4 Applewood Square
- 5219 Oakbrook Dr
- 12 Citation Dr
- 200 W Woodcroft Pkwy Unit 60c
- 200 W Woodcroft Pkwy Unit 53b
- 1003 Regalia Rd Unit 33
- 5500 Fortunes Ridge Dr Unit 80b
- 5500 Fortunes Ridge Dr Unit 89B
- 5515 S Roxboro St Unit 4
- 5515 S Roxboro St Unit 3
- 6 Sanderling Ct
- 12 Sanderling Ct
- 4 Sanderling Ct
- 14 Sanderling Ct
- 25 Copper Hill Ct
- 11 Sanderling Ct
- 5 Sanderling Ct
- 23 Copper Hill Ct
- 7 Fallen Oak Ct
- 15 Sanderling Ct
- 2 Sanderling Ct
- 5 Fallen Oak Ct
- 21 Copper Hill Ct
- 4500 Highgate Dr
- 18 Sanderling Ct
- 29 Copper Hill Ct
- 4506 Highgate Dr
- 19 Copper Hill Ct
- 9 Fallen Oak Ct
- 4416 Highgate Dr
Your Personal Tour Guide
Ask me questions while you tour the home.