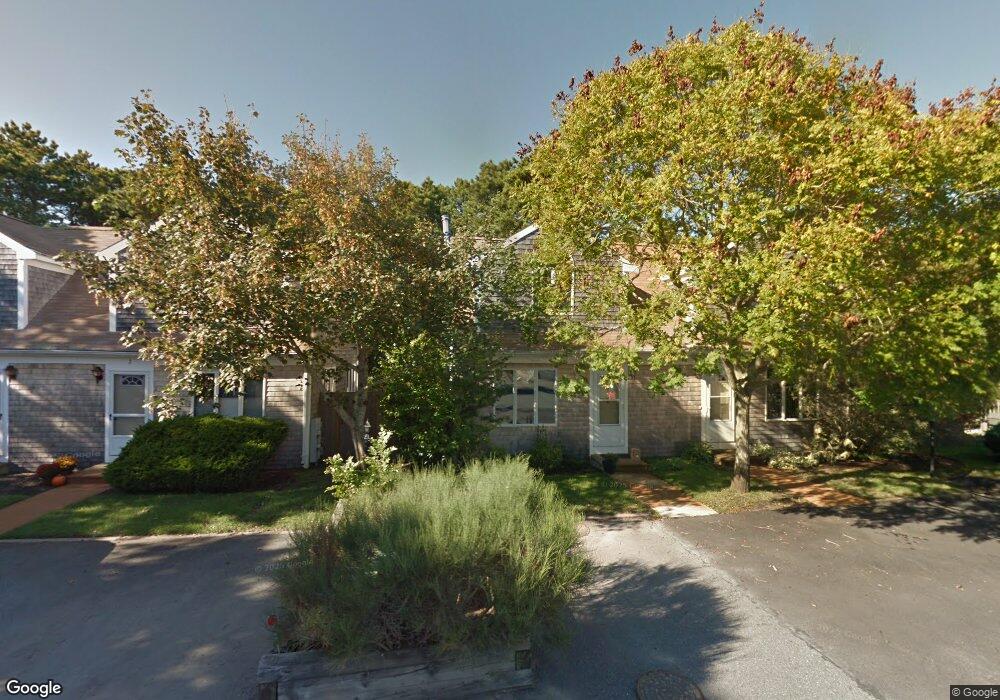
8 Seashore Park Dr Unit 10 Provincetown, MA 02657
Estimated Value: $809,000 - $1,006,000
2
Beds
2
Baths
1,320
Sq Ft
$678/Sq Ft
Est. Value
About This Home
This home is located at 8 Seashore Park Dr Unit 10, Provincetown, MA 02657 and is currently estimated at $894,693, approximately $677 per square foot. 8 Seashore Park Dr Unit 10 is a home located in Barnstable County with nearby schools including Provincetown Schools.
Ownership History
Date
Name
Owned For
Owner Type
Purchase Details
Closed on
Sep 25, 2015
Sold by
Minassian Harry and Minassian Marcia
Bought by
Marcia Ward-Minassian and Marcia Ward-Minassian
Current Estimated Value
Purchase Details
Closed on
Sep 13, 2000
Sold by
Golden James F
Bought by
Minassian Harry and Minassian Marcia
Home Financials for this Owner
Home Financials are based on the most recent Mortgage that was taken out on this home.
Original Mortgage
$123,000
Interest Rate
8.07%
Mortgage Type
Purchase Money Mortgage
Purchase Details
Closed on
Dec 31, 1993
Sold by
Seashore Pines Rt and Rogers Charles N
Bought by
Kepler Valerie J
Home Financials for this Owner
Home Financials are based on the most recent Mortgage that was taken out on this home.
Original Mortgage
$82,800
Interest Rate
7%
Mortgage Type
Purchase Money Mortgage
Create a Home Valuation Report for This Property
The Home Valuation Report is an in-depth analysis detailing your home's value as well as a comparison with similar homes in the area
Home Values in the Area
Average Home Value in this Area
Purchase History
| Date | Buyer | Sale Price | Title Company |
|---|---|---|---|
| Marcia Ward-Minassian | -- | -- | |
| Minassian Harry | $223,000 | -- | |
| Minassian Harry | $223,000 | -- | |
| Kepler Valerie J | $92,000 | -- |
Source: Public Records
Mortgage History
| Date | Status | Borrower | Loan Amount |
|---|---|---|---|
| Previous Owner | Minassian Harry | $260,000 | |
| Previous Owner | Minassian Harry | $123,000 | |
| Previous Owner | Kepler Valerie J | $82,800 |
Source: Public Records
Tax History Compared to Growth
Tax History
| Year | Tax Paid | Tax Assessment Tax Assessment Total Assessment is a certain percentage of the fair market value that is determined by local assessors to be the total taxable value of land and additions on the property. | Land | Improvement |
|---|---|---|---|---|
| 2025 | $4,175 | $745,600 | $0 | $745,600 |
| 2024 | $3,785 | $678,300 | $0 | $678,300 |
| 2023 | $3,348 | $559,800 | $0 | $559,800 |
| 2022 | $3,274 | $491,600 | $0 | $491,600 |
| 2021 | $3,180 | $449,200 | $0 | $449,200 |
| 2020 | $2,919 | $441,000 | $0 | $441,000 |
| 2019 | $2,939 | $416,300 | $0 | $416,300 |
| 2018 | $2,865 | $384,600 | $0 | $384,600 |
| 2017 | $2,884 | $374,100 | $0 | $374,100 |
| 2016 | $2,820 | $361,600 | $0 | $361,600 |
| 2015 | $2,543 | $344,600 | $0 | $344,600 |
Source: Public Records
Map
Nearby Homes
- 10 Seashore Park Dr Unit GG
- 14 Nelson Ave
- 50 Nelson Ave Unit 6
- 50 Nelson Ave Unit 8
- 16 Off Conwell St
- 33 Conwell St Unit 5B
- 33 Conwell St Unit 1
- 46 Harry Kemp Way Unit 2
- 48 Harry Kemp Way Unit 3
- 13 Old Colony Way
- 86 Harry Kemp Way Unit 2
- 36 Pearl St Unit 2
- 36 Pearl St Unit 3
- 34 Pearl St Unit 2
- 21 Priscilla Alden Rd Unit A
- 100 Alden St Unit 203
- 4 Railroad Ave Unit 2
- 184 Bradford St Unit 1
- 167 Bradford St Unit B
- 15 Center St
- 8 Seashore Park Dr Unit 16
- 8 Seashore Park Dr Unit 15
- 8 Seashore Park Dr Unit 14
- 8 Seashore Park Dr Unit 13
- 8 Seashore Park Dr Unit 12
- 8 Seashore Park Dr Unit 9
- 8 Seashore Park Dr
- 8 Seashore Park Dr Unit 7
- 8 Seashore Park Dr Unit 6
- 8 Seashore Park Dr Unit 5
- 8 Seashore Park Dr Unit 4
- 8 Seashore Park Dr Unit 3
- 8 Seashore Park Dr Unit 2
- 8 Seashore Park Dr Unit 1
- 8 Seashore Park Dr Unit 8
- 0 Seashore Park Dr Unit FF 2036835
- 0 Seashore Park Dr Unit 6 2037860
- 0 Seashore Park Dr Unit T 2038304
- 0 Seashore Park Dr Unit 10-G 2031342
- 0 Seashore Park Dr Unit P 2036364