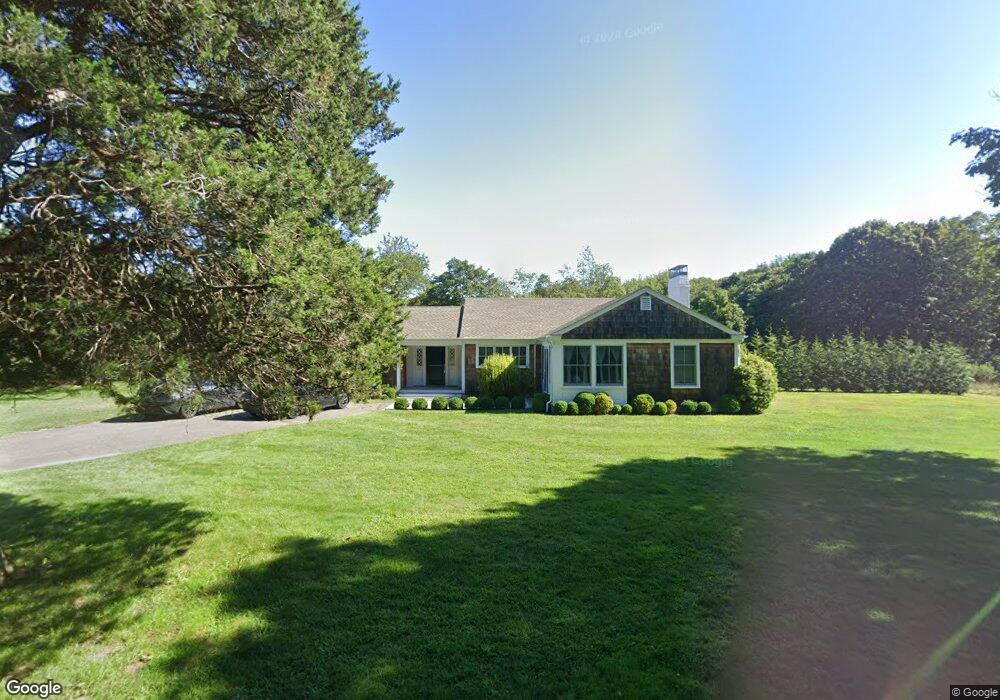
8 Seely Ln Sag Harbor, NY 11963
Estimated Value: $2,326,000 - $3,235,000
3
Beds
2
Baths
2,136
Sq Ft
$1,274/Sq Ft
Est. Value
About This Home
This home is located at 8 Seely Ln, Sag Harbor, NY 11963 and is currently estimated at $2,721,280, approximately $1,274 per square foot. 8 Seely Ln is a home located in Suffolk County with nearby schools including Sag Harbor Elementary School and Pierson Middle/High School.
Ownership History
Date
Name
Owned For
Owner Type
Purchase Details
Closed on
Jul 11, 2025
Sold by
Bennett Bruce J and Bennett Virginia
Bought by
Meers Crystal and Miller Murray
Current Estimated Value
Home Financials for this Owner
Home Financials are based on the most recent Mortgage that was taken out on this home.
Original Mortgage
$1,000,000
Outstanding Balance
$998,293
Interest Rate
6.81%
Mortgage Type
New Conventional
Estimated Equity
$1,722,987
Purchase Details
Closed on
Mar 23, 1999
Sold by
Bennett Guy D and Bennett Alice D
Bought by
Bennett Bruce J and Armstrong Barbara
Create a Home Valuation Report for This Property
The Home Valuation Report is an in-depth analysis detailing your home's value as well as a comparison with similar homes in the area
Home Values in the Area
Average Home Value in this Area
Purchase History
| Date | Buyer | Sale Price | Title Company |
|---|---|---|---|
| Meers Crystal | $2,500,000 | -- | |
| Meers Crystal | $2,500,000 | -- | |
| Bennett Bruce J | -- | -- | |
| Bennett Bruce J | -- | -- |
Source: Public Records
Mortgage History
| Date | Status | Borrower | Loan Amount |
|---|---|---|---|
| Open | Meers Crystal | $1,000,000 | |
| Closed | Meers Crystal | $1,000,000 |
Source: Public Records
Tax History Compared to Growth
Tax History
| Year | Tax Paid | Tax Assessment Tax Assessment Total Assessment is a certain percentage of the fair market value that is determined by local assessors to be the total taxable value of land and additions on the property. | Land | Improvement |
|---|---|---|---|---|
| 2024 | $1,415 | $1,221,500 | $771,400 | $450,100 |
| 2023 | $743 | $1,221,500 | $771,400 | $450,100 |
| 2022 | $7,051 | $1,179,600 | $771,400 | $408,200 |
| 2021 | $7,051 | $1,179,600 | $771,400 | $408,200 |
| 2020 | $6,478 | $1,154,900 | $771,400 | $383,500 |
| 2019 | $6,421 | $0 | $0 | $0 |
| 2018 | -- | $1,021,300 | $771,400 | $249,900 |
| 2017 | $7,131 | $1,124,800 | $859,100 | $265,700 |
| 2016 | $6,885 | $1,046,700 | $781,000 | $265,700 |
| 2015 | -- | $1,046,700 | $781,000 | $265,700 |
| 2014 | -- | $969,500 | $663,900 | $305,600 |
Source: Public Records
Map
Nearby Homes