
Seller's Agent in 2019
Kathy Snyder
Monument Realty
(603) 557-8599
5 in this area
221 Total Sales
Estimated Value: $587,347 - $651,000
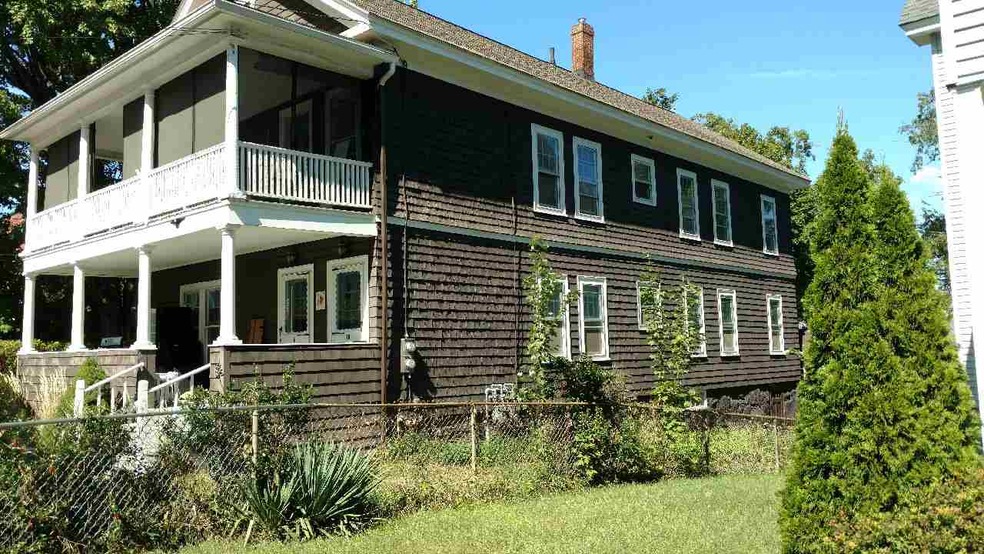
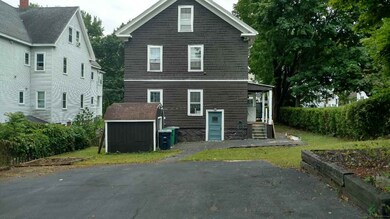
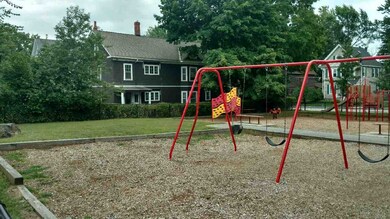
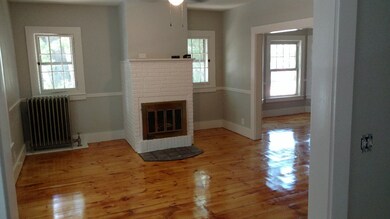
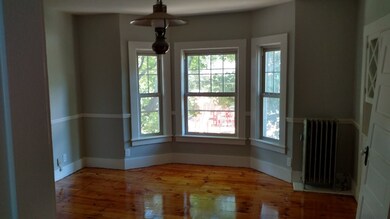
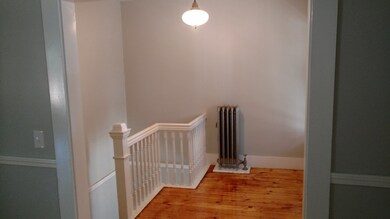
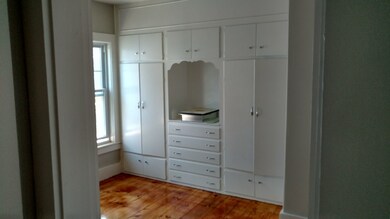
Newly renovated 3 bedroom apartment in desirable North End of Nashua. A parent's dream, located right next to the Shattuck Street Tot Lot! Yes, you can see the playground from the kitchen window! Floors just refinished, freshly painted, kitchen remodeled. Lovely dining room, gorgeous living room with fireplace, and covered porch. Front and rear entrance. Some storage available in basement.
| Date | Buyer | Sale Price | Title Company |
|---|---|---|---|
| Megan Rhynehart Roger | $370,000 | -- |
| Date | Status | Borrower | Loan Amount |
|---|---|---|---|
| Open | Megan Rhynehart Roger | $277,500 |
| Date | Event | Price | List to Sale | Price per Sq Ft | Prior Sale |
|---|---|---|---|---|---|
| 10/10/2019 10/10/19 | Rented | $1,800 | 0.0% | -- | |
| 09/16/2019 09/16/19 | For Rent | $1,800 | 0.0% | -- | |
| 07/26/2019 07/26/19 | Sold | $370,000 | 0.0% | $135 / Sq Ft | View Prior Sale |
| 07/26/2019 07/26/19 | Pending | -- | -- | -- | |
| 05/24/2019 05/24/19 | For Sale | $370,000 | -- | $135 / Sq Ft |
| Year | Tax Paid | Tax Assessment Tax Assessment Total Assessment is a certain percentage of the fair market value that is determined by local assessors to be the total taxable value of land and additions on the property. | Land | Improvement |
|---|---|---|---|---|
| 2024 | $10,198 | $641,400 | $140,500 | $500,900 |
| 2023 | $9,472 | $519,600 | $112,400 | $407,200 |
| 2022 | $9,389 | $519,600 | $112,400 | $407,200 |
| 2021 | $6,237 | $268,600 | $63,700 | $204,900 |
| 2020 | $6,096 | $269,600 | $63,700 | $205,900 |
| 2019 | $5,845 | $268,600 | $63,700 | $204,900 |
| 2018 | $5,697 | $268,600 | $63,700 | $204,900 |
| 2017 | $5,467 | $212,000 | $73,300 | $138,700 |
| 2016 | $5,315 | $212,000 | $73,300 | $138,700 |
| 2015 | $5,200 | $212,000 | $73,300 | $138,700 |
| 2014 | $5,099 | $212,000 | $73,300 | $138,700 |
Seller's Agent in 2019
Kathy Snyder
Monument Realty
(603) 557-8599
5 in this area
221 Total Sales
Landlord's Agent in 2019
Karl Zahn
East Key Realty
(603) 234-3431
3 in this area
104 Total Sales
Source: PrimeMLS
MLS Number: 4776586
APN: NASH-000044-000000-000091
Disclaimer: Certain information contained herein is derived from information provided by parties other than Homes.com. All information provided is deemed reliable, but is not guaranteed to be accurate and should be independently verified.
![]() Copyright 2025 PrimeMLS, Inc. All rights reserved. This information is deemed reliable, but not guaranteed. The data relating to real estate displayed on this display comes in part from the IDX Program of PrimeMLS. The information being provided is for consumers’ personal, non-commercial use and may not be used for any purpose other than to identify prospective properties consumers may be interested in purchasing.
Copyright 2025 PrimeMLS, Inc. All rights reserved. This information is deemed reliable, but not guaranteed. The data relating to real estate displayed on this display comes in part from the IDX Program of PrimeMLS. The information being provided is for consumers’ personal, non-commercial use and may not be used for any purpose other than to identify prospective properties consumers may be interested in purchasing.