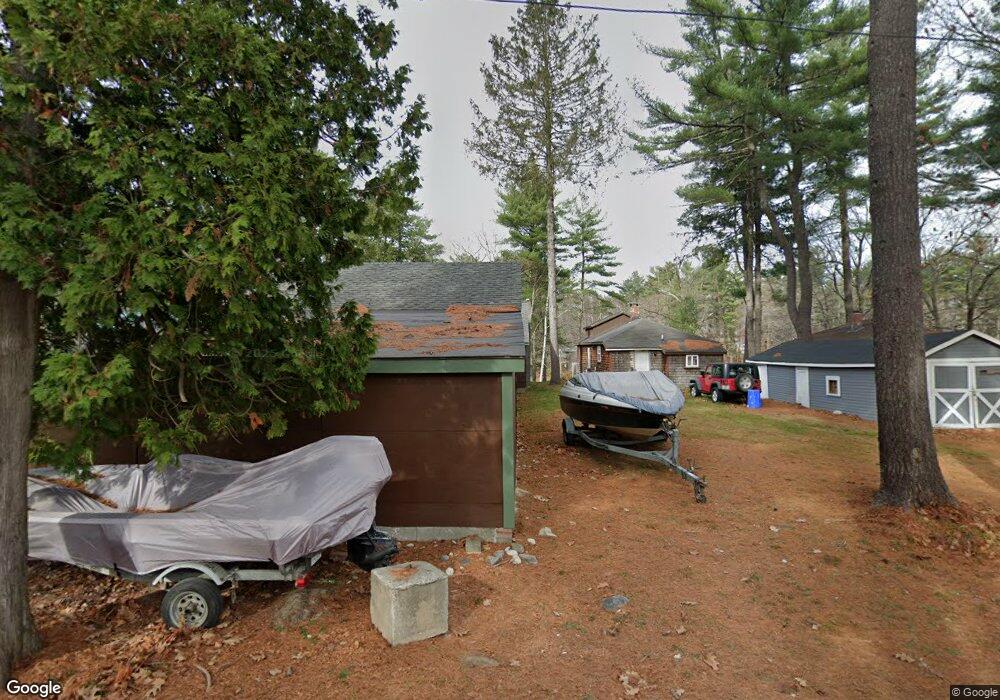
8 Shore Rd Windham, ME 04062
Estimated Value: $440,000 - $495,428
2
Beds
1
Bath
1,350
Sq Ft
$344/Sq Ft
Est. Value
About This Home
This home is located at 8 Shore Rd, Windham, ME 04062 and is currently estimated at $463,857, approximately $343 per square foot. 8 Shore Rd is a home located in Cumberland County with nearby schools including Manchester School, Windham Primary School, and Windham Middle School.
Ownership History
Date
Name
Owned For
Owner Type
Purchase Details
Closed on
Dec 9, 2021
Sold by
Sawyer Theresa A
Bought by
Sawyer Morgan L and Sawyer Grace E
Current Estimated Value
Purchase Details
Closed on
Sep 27, 2019
Sold by
Cartwright Joyce A
Bought by
Sawyer Teresa A
Home Financials for this Owner
Home Financials are based on the most recent Mortgage that was taken out on this home.
Original Mortgage
$170,000
Interest Rate
3.6%
Mortgage Type
New Conventional
Create a Home Valuation Report for This Property
The Home Valuation Report is an in-depth analysis detailing your home's value as well as a comparison with similar homes in the area
Home Values in the Area
Average Home Value in this Area
Purchase History
| Date | Buyer | Sale Price | Title Company |
|---|---|---|---|
| Sawyer Morgan L | -- | None Available | |
| Sawyer Teresa A | -- | -- |
Source: Public Records
Mortgage History
| Date | Status | Borrower | Loan Amount |
|---|---|---|---|
| Previous Owner | Sawyer Teresa A | $170,000 |
Source: Public Records
Tax History
| Year | Tax Paid | Tax Assessment Tax Assessment Total Assessment is a certain percentage of the fair market value that is determined by local assessors to be the total taxable value of land and additions on the property. | Land | Improvement |
|---|---|---|---|---|
| 2025 | $5,000 | $414,600 | $180,200 | $234,400 |
| 2024 | $4,393 | $383,000 | $148,600 | $234,400 |
| 2023 | $4,045 | $361,200 | $138,200 | $223,000 |
| 2022 | $3,726 | $320,900 | $122,800 | $198,100 |
| 2021 | $3,421 | $271,500 | $98,900 | $172,600 |
| 2020 | $3,603 | $240,200 | $97,600 | $142,600 |
| 2019 | $3,517 | $240,200 | $97,600 | $142,600 |
| 2018 | $3,466 | $228,300 | $102,400 | $125,900 |
| 2017 | $3,189 | $194,100 | $93,400 | $100,700 |
| 2016 | $3,047 | $194,100 | $93,400 | $100,700 |
| 2015 | $2,941 | $194,100 | $93,400 | $100,700 |
| 2014 | $2,847 | $194,100 | $93,400 | $100,700 |
| 2013 | $2,805 | $194,100 | $93,400 | $100,700 |
Source: Public Records
Map
Nearby Homes
- 99 Enterprise Dr
- 34 Trails End Rd
- 11 Clover Ln
- lot #8 Bedrock Terrace
- 96 Mineral Spring Rd
- 1042 Roosevelt Trail
- Lot #1 Chamberlain Dr
- 1083 Roosevelt Trail
- 10 Abby Rd
- 1 Matinicus Way Unit 1
- 103 Basin Rd
- 14 Sabbady Point Rd
- 5 Sandbar Rd
- 75 Tandberg Trail
- 34 Robin Ln
- 34 Many Oaks Ln
- 1112 Roosevelt Trail Unit 8
- 14 Emerson Dr
- 74 Emerson Dr
- 20 Bittersweet Way
Your Personal Tour Guide
Ask me questions while you tour the home.