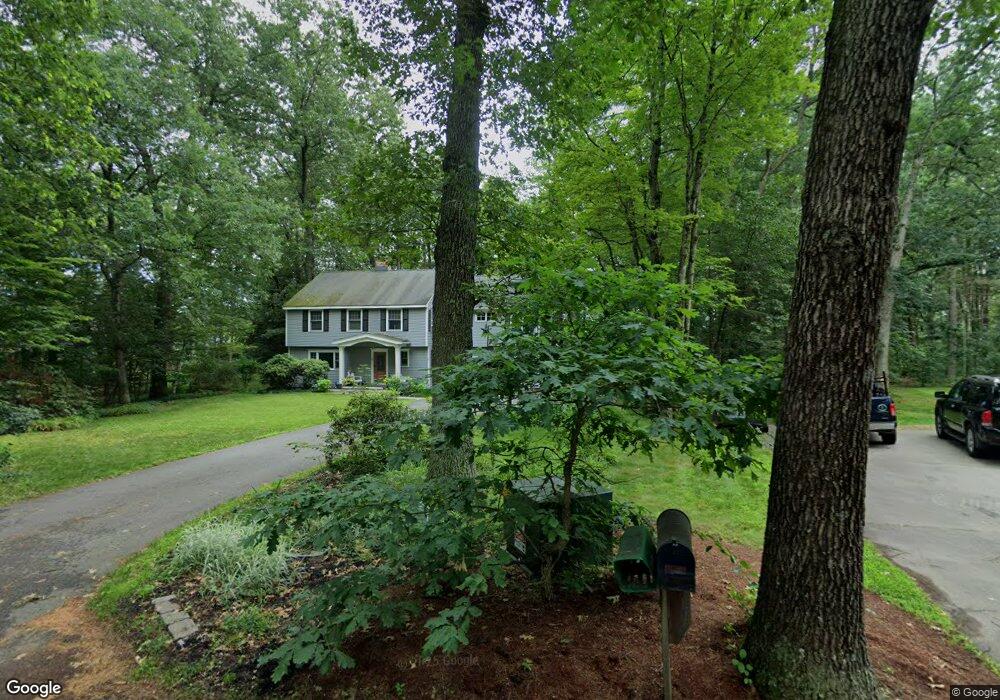
8 Silver Birch Ln Littleton, MA 01460
Estimated Value: $982,484 - $1,210,000
4
Beds
4
Baths
3,176
Sq Ft
$351/Sq Ft
Est. Value
About This Home
This home is located at 8 Silver Birch Ln, Littleton, MA 01460 and is currently estimated at $1,113,621, approximately $350 per square foot. 8 Silver Birch Ln is a home located in Middlesex County with nearby schools including Shaker Lane Elementary School, Russell Street Elementary School, and Littleton Middle School.
Ownership History
Date
Name
Owned For
Owner Type
Purchase Details
Closed on
May 3, 2013
Sold by
Milner Julie and Milner Darrin
Bought by
Milner Julie and Milner Darrin
Current Estimated Value
Home Financials for this Owner
Home Financials are based on the most recent Mortgage that was taken out on this home.
Original Mortgage
$260,983
Outstanding Balance
$122,419
Interest Rate
3.57%
Mortgage Type
New Conventional
Estimated Equity
$991,202
Purchase Details
Closed on
Jan 9, 2001
Sold by
Hemerlein Paul and Hemerlein Joanne S
Bought by
Sarkisian Julie and Milner Darrin
Home Financials for this Owner
Home Financials are based on the most recent Mortgage that was taken out on this home.
Original Mortgage
$373,050
Interest Rate
7.69%
Mortgage Type
Purchase Money Mortgage
Purchase Details
Closed on
Jun 25, 1992
Sold by
Witek Richard T and Witek Deborah A
Bought by
Legare Edward J and Legare Beth A
Create a Home Valuation Report for This Property
The Home Valuation Report is an in-depth analysis detailing your home's value as well as a comparison with similar homes in the area
Home Values in the Area
Average Home Value in this Area
Purchase History
| Date | Buyer | Sale Price | Title Company |
|---|---|---|---|
| Milner Julie | -- | -- | |
| Sarkisian Julie | $414,500 | -- | |
| Legare Edward J | $210,000 | -- |
Source: Public Records
Mortgage History
| Date | Status | Borrower | Loan Amount |
|---|---|---|---|
| Open | Milner Julie | $260,983 | |
| Previous Owner | Legare Edward J | $295,000 | |
| Previous Owner | Legare Edward J | $375,000 | |
| Previous Owner | Legare Edward J | $373,050 |
Source: Public Records
Tax History Compared to Growth
Tax History
| Year | Tax Paid | Tax Assessment Tax Assessment Total Assessment is a certain percentage of the fair market value that is determined by local assessors to be the total taxable value of land and additions on the property. | Land | Improvement |
|---|---|---|---|---|
| 2025 | $128 | $861,900 | $255,600 | $606,300 |
| 2024 | $12,814 | $863,500 | $255,600 | $607,900 |
| 2023 | $12,163 | $748,500 | $236,000 | $512,500 |
| 2022 | $11,497 | $649,200 | $236,000 | $413,200 |
| 2021 | $11,466 | $606,000 | $227,300 | $378,700 |
| 2020 | $10,436 | $587,300 | $212,000 | $375,300 |
| 2019 | $10,529 | $563,300 | $183,800 | $379,500 |
| 2018 | $10,053 | $554,200 | $181,600 | $372,600 |
| 2017 | $9,692 | $534,000 | $181,600 | $352,400 |
| 2016 | $9,388 | $530,700 | $181,600 | $349,100 |
| 2015 | $9,063 | $500,700 | $157,700 | $343,000 |
Source: Public Records
Map
Nearby Homes
- 36 Whitetail Way
- 11 (Lt 45) Darrell Dr
- 9 (Lt 44) Darrell Dr
- Lot 7 Noble Path
- Lot 6 Noble Path
- 222 Forge Village Rd
- 26 New Pond Rd
- 8 Sandy Beach Rd
- 0 Ayer Rd
- 17 Hartwell Ave
- 12 Brookfield Dr Unit A
- 20 Murray Park Rd
- 16 Abbot St
- 4 Spectacle Pond Rd
- 66 Patten Rd
- 4 Casie Ln
- 239 Ayer Rd Unit 16
- 1 Thistle Ln
- 18 Pleasant St
- 18 Mill Ln
- 9 Silver Birch Ln
- 6 Silver Birch Ln
- 4 Silver Birch Ln
- 3 Silver Birch Ln
- 2 Silver Birch Ln
- 11 Colburn Ln
- 9 Colburn Ln
- 4 Hiddenwood Path
- 13 Colburn Ln
- 7 Colburn Ln
- 1 Silver Birch Ln
- 5 Hiddenwood Path
- 15 Colburn Ln
- 620 Great Rd
- 2 Hiddenwood Path
- 0 Colburn Lane Lot 10
- 12 Colburn Ln
- 10 Colburn Ln
- 3 Sheridan Ln
- 14 Colburn Ln