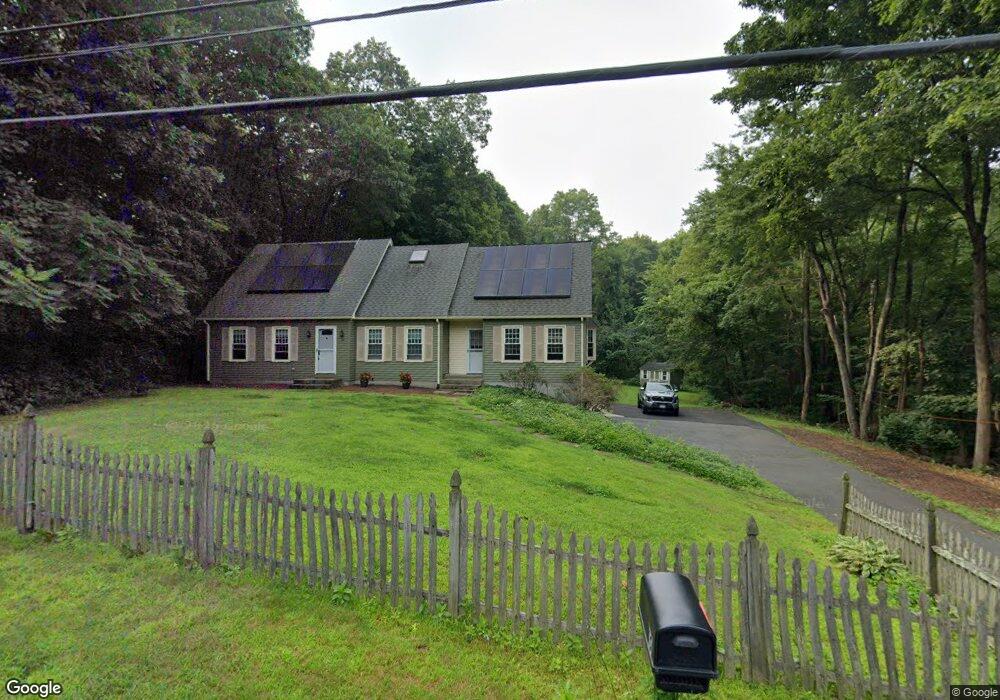
8 Soule Rd Wilbraham, MA 01095
Estimated Value: $477,571 - $643,000
4
Beds
2
Baths
2,100
Sq Ft
$257/Sq Ft
Est. Value
About This Home
This home is located at 8 Soule Rd, Wilbraham, MA 01095 and is currently estimated at $539,643, approximately $256 per square foot. 8 Soule Rd is a home located in Hampden County with nearby schools including Minnechaug Regional High School and Wilbraham & Monson Academy.
Ownership History
Date
Name
Owned For
Owner Type
Purchase Details
Closed on
Aug 25, 2006
Sold by
Oconnor Alicia M and Oconnor John F
Bought by
Oconnor Alicia M
Current Estimated Value
Home Financials for this Owner
Home Financials are based on the most recent Mortgage that was taken out on this home.
Original Mortgage
$188,000
Outstanding Balance
$113,882
Interest Rate
6.83%
Estimated Equity
$425,761
Purchase Details
Closed on
Sep 30, 1999
Sold by
Mauro Charles and Mauro Agnes S
Bought by
Oconnor John F and Swiderski Alicia M
Purchase Details
Closed on
Dec 29, 1988
Sold by
Potetz Frank J
Bought by
Mauro Charles
Create a Home Valuation Report for This Property
The Home Valuation Report is an in-depth analysis detailing your home's value as well as a comparison with similar homes in the area
Home Values in the Area
Average Home Value in this Area
Purchase History
| Date | Buyer | Sale Price | Title Company |
|---|---|---|---|
| Oconnor Alicia M | -- | -- | |
| Oconnor John F | $198,000 | -- | |
| Mauro Charles | $220,000 | -- |
Source: Public Records
Mortgage History
| Date | Status | Borrower | Loan Amount |
|---|---|---|---|
| Open | Mauro Charles | $20,000 | |
| Open | Oconnor Alicia M | $188,000 | |
| Previous Owner | Mauro Charles | $174,000 | |
| Previous Owner | Mauro Charles | $150,000 |
Source: Public Records
Tax History Compared to Growth
Tax History
| Year | Tax Paid | Tax Assessment Tax Assessment Total Assessment is a certain percentage of the fair market value that is determined by local assessors to be the total taxable value of land and additions on the property. | Land | Improvement |
|---|---|---|---|---|
| 2025 | $7,461 | $417,300 | $95,000 | $322,300 |
| 2024 | $6,882 | $372,000 | $95,000 | $277,000 |
| 2023 | $6,651 | $348,900 | $95,000 | $253,900 |
| 2022 | $6,651 | $324,600 | $95,000 | $229,600 |
| 2021 | $6,468 | $281,700 | $103,700 | $178,000 |
| 2020 | $6,304 | $281,700 | $103,700 | $178,000 |
| 2019 | $6,141 | $281,700 | $103,700 | $178,000 |
| 2018 | $5,914 | $261,200 | $103,700 | $157,500 |
| 2017 | $5,746 | $261,200 | $103,700 | $157,500 |
| 2016 | $5,594 | $259,000 | $109,800 | $149,200 |
| 2015 | $5,408 | $259,000 | $109,800 | $149,200 |
Source: Public Records
Map
Nearby Homes
- 374
- 19 Forest Hill Rd
- 230V Burleigh Rd
- 6 Katie St
- 59 Baldwin Dr
- 1028 Tinkham Rd
- 390 Soule Rd
- 460 Soule Rd
- 68 Monson Rd
- 17 Peak Rd
- 767 Stony Hill Rd
- 85 Brookhaven Dr
- 760 Stony Hill Rd
- 98 Brookhaven Dr
- 763 Stony Hill Rd
- 407 Monson Rd
- 0 Mountain Rd Unit 73267162
- 0 Mountain Rd Unit 72942534
- 14 Brookdale Dr
- 4 Millbrook Dr