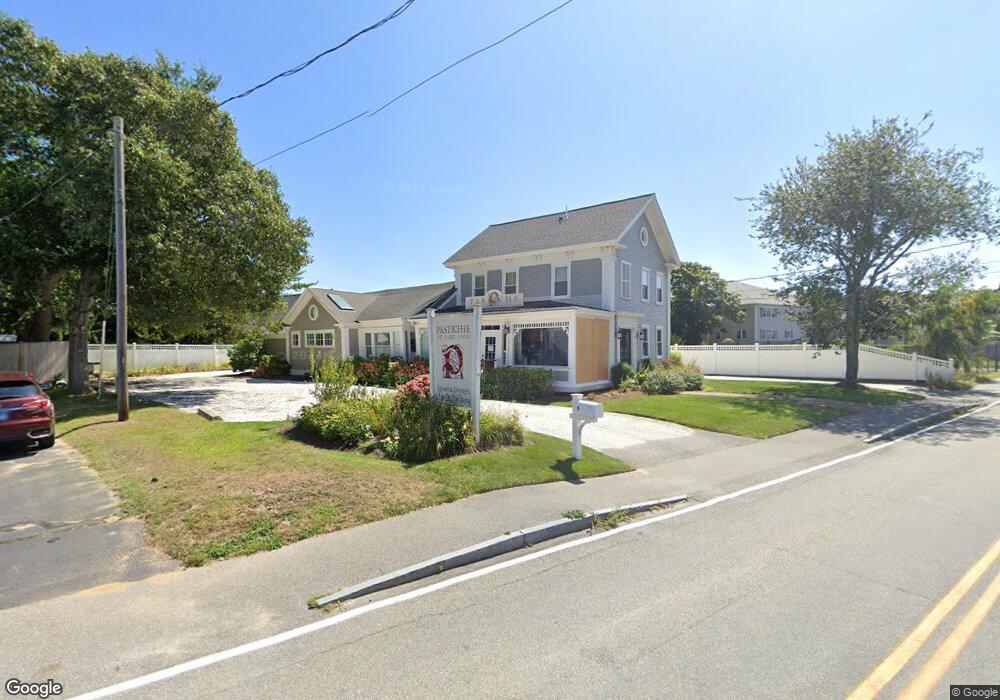
8 South St Dennis Port, MA 02639
Dennis Port NeighborhoodEstimated Value: $714,500
3
Beds
3
Baths
3,178
Sq Ft
$225/Sq Ft
Est. Value
About This Home
This home is located at 8 South St, Dennis Port, MA 02639 and is currently priced at $714,500, approximately $224 per square foot. 8 South St is a home located in Barnstable County with nearby schools including Dennis-Yarmouth Regional High School.
Ownership History
Date
Name
Owned For
Owner Type
Purchase Details
Closed on
Jul 17, 2008
Sold by
Macphee Irina S and Weatherly Irina S
Bought by
Irina S Macphee Lt
Current Estimated Value
Purchase Details
Closed on
Aug 2, 2004
Sold by
Haddad Daniel
Bought by
Weatherley Irina S
Home Financials for this Owner
Home Financials are based on the most recent Mortgage that was taken out on this home.
Original Mortgage
$225,000
Interest Rate
6.33%
Mortgage Type
Commercial
Purchase Details
Closed on
Apr 10, 2000
Sold by
Colombo David L
Bought by
Haddad Daniel
Create a Home Valuation Report for This Property
The Home Valuation Report is an in-depth analysis detailing your home's value as well as a comparison with similar homes in the area
Home Values in the Area
Average Home Value in this Area
Purchase History
| Date | Buyer | Sale Price | Title Company |
|---|---|---|---|
| Irina S Macphee Lt | -- | -- | |
| Weatherley Irina S | $355,000 | -- | |
| Haddad Daniel | $208,000 | -- |
Source: Public Records
Mortgage History
| Date | Status | Borrower | Loan Amount |
|---|---|---|---|
| Previous Owner | Weatherley Irina S | $225,000 | |
| Previous Owner | Weatherley Irina S | $180,000 | |
| Previous Owner | Haddad Daniel | $110,000 |
Source: Public Records
Tax History Compared to Growth
Tax History
| Year | Tax Paid | Tax Assessment Tax Assessment Total Assessment is a certain percentage of the fair market value that is determined by local assessors to be the total taxable value of land and additions on the property. | Land | Improvement |
|---|---|---|---|---|
| 2025 | $3,306 | $763,600 | $173,400 | $590,200 |
| 2024 | $3,026 | $689,200 | $166,800 | $522,400 |
| 2023 | $2,881 | $616,900 | $151,600 | $465,300 |
| 2022 | $2,759 | $492,700 | $136,600 | $356,100 |
| 2021 | $1,943 | $498,800 | $133,900 | $364,900 |
| 2020 | $1,890 | $492,300 | $123,600 | $368,700 |
| 2019 | $3,231 | $523,600 | $121,200 | $402,400 |
| 2018 | $9 | $479,700 | $125,000 | $354,700 |
| 2017 | $2,967 | $482,500 | $115,400 | $367,100 |
| 2016 | $2,660 | $407,400 | $120,200 | $287,200 |
| 2015 | $2,607 | $407,400 | $120,200 | $287,200 |
| 2014 | $2,555 | $402,300 | $105,800 | $296,500 |
Source: Public Records
Map
Nearby Homes
- 47 Telegraph Rd Unit 1
- 10 Candlewood Ln Unit 2-1
- 12 Candlewood Ln Unit 2-9
- 12 Candlewood Ln Unit 1-6
- 9 Country Ln
- 73 Division St
- 12 Cross St
- 141 Division St
- 141 Division St
- 148 Belmont Rd
- 104 Toms Path
- 45 Route 28
- 104 Toms Path
- 79 Massachusetts 28
- 9 Bells Neck Rd Unit 10
- 6 Bayberry Ln
- 78 Upper County Rd Unit A&B
- 78 Upper County Rd
- 268 Main St
- 3 Fairbanks Dr
- 8 South St Unit 1
- 28 South St
- 11 South St
- 14 South St
- 613 Main St
- 645 Main St
- 645 Main St
- 10 South St Unit 2-8
- 10 South St Unit 2-7
- 10 South St Unit 2-6
- 10 South St Unit 2-5
- 10 South St Unit 2-4
- 10 South St Unit 2-3
- 10 South St Unit 2-2
- 10 South St Unit 1-8
- 10 South St Unit 1-7
- 10 South St Unit 1-6
- 10 South St Unit 1-5
- 10 South St Unit 1-4
- 10 South St Unit 1-3