Estimated Value: $341,758 - $446,000
--
Bed
--
Bath
756
Sq Ft
$538/Sq Ft
Est. Value
About This Home
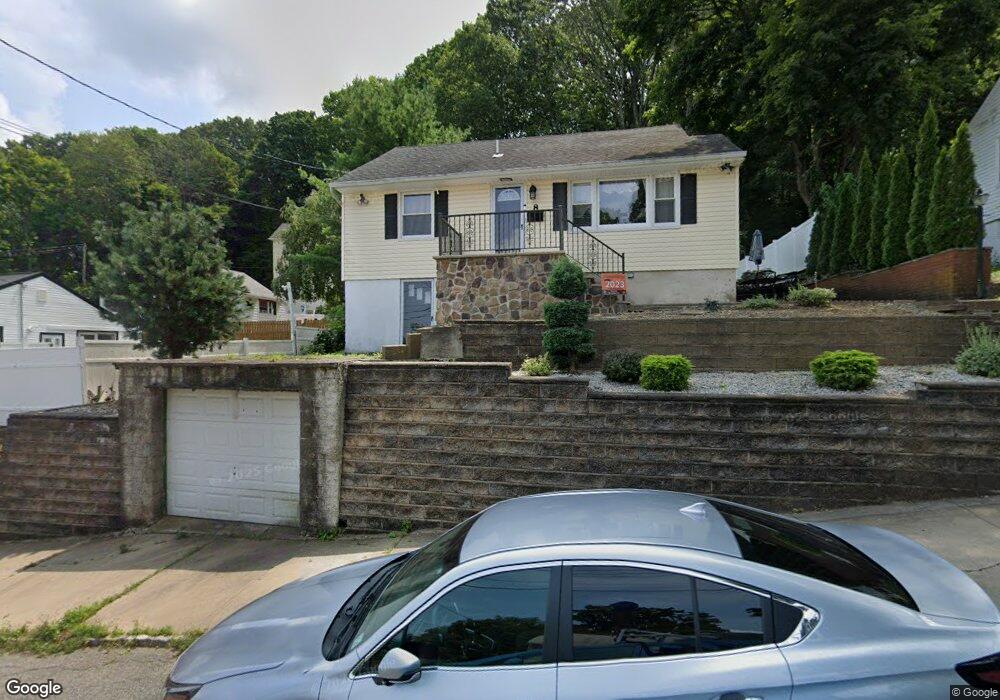
This home is located at 8 South St, Dover, NJ 07801 and is currently estimated at $406,940, approximately $538 per square foot. 8 South St is a home located in Morris County with nearby schools including Dover Middle School and Dover High School.
Ownership History
Date
Name
Owned For
Owner Type
Purchase Details
Closed on
Jun 26, 2007
Sold by
Karcich Ronald
Bought by
Cruz Rita
Current Estimated Value
Home Financials for this Owner
Home Financials are based on the most recent Mortgage that was taken out on this home.
Original Mortgage
$320,000
Interest Rate
7.62%
Mortgage Type
Purchase Money Mortgage
Purchase Details
Closed on
Nov 4, 2003
Sold by
Galvan Rpy
Bought by
Karcich Ronald
Home Financials for this Owner
Home Financials are based on the most recent Mortgage that was taken out on this home.
Original Mortgage
$187,150
Interest Rate
6.28%
Purchase Details
Closed on
Jul 31, 1997
Sold by
Claus Jean M and Carole Duffy M
Bought by
Galvan Roy and Galvan Kimberly
Home Financials for this Owner
Home Financials are based on the most recent Mortgage that was taken out on this home.
Original Mortgage
$93,100
Interest Rate
7.5%
Create a Home Valuation Report for This Property
The Home Valuation Report is an in-depth analysis detailing your home's value as well as a comparison with similar homes in the area
Home Values in the Area
Average Home Value in this Area
Purchase History
| Date | Buyer | Sale Price | Title Company |
|---|---|---|---|
| Cruz Rita | $320,000 | None Available | |
| Karcich Ronald | $197,000 | -- | |
| Galvan Roy | $98,000 | -- |
Source: Public Records
Mortgage History
| Date | Status | Borrower | Loan Amount |
|---|---|---|---|
| Previous Owner | Cruz Rita | $320,000 | |
| Previous Owner | Karcich Ronald | $187,150 | |
| Previous Owner | Galvan Roy | $93,100 |
Source: Public Records
Tax History Compared to Growth
Tax History
| Year | Tax Paid | Tax Assessment Tax Assessment Total Assessment is a certain percentage of the fair market value that is determined by local assessors to be the total taxable value of land and additions on the property. | Land | Improvement |
|---|---|---|---|---|
| 2025 | $6,179 | $188,800 | $90,000 | $98,800 |
| 2024 | $5,960 | $188,800 | $90,000 | $98,800 |
| 2023 | $5,960 | $188,800 | $90,000 | $98,800 |
| 2022 | $5,050 | $188,800 | $90,000 | $98,800 |
| 2021 | $5,050 | $188,800 | $90,000 | $98,800 |
| 2020 | $5,371 | $188,800 | $90,000 | $98,800 |
| 2019 | $5,149 | $188,800 | $90,000 | $98,800 |
| 2018 | $4,865 | $188,800 | $90,000 | $98,800 |
| 2017 | $4,644 | $188,800 | $90,000 | $98,800 |
| 2016 | $4,535 | $188,800 | $90,000 | $98,800 |
| 2015 | $5,236 | $254,800 | $136,700 | $118,100 |
| 2014 | $5,183 | $254,800 | $136,700 | $118,100 |
Source: Public Records
Map
Nearby Homes
- 104 Jordan Terrace
- 48 Byram Ave
- 68 Grant St
- 61 W Munson Ave
- 134 W Munson Ave
- 24 Livingston Ave
- 119 Millbrook Ave
- 41 Livingston Ave
- 142 W Blackwell St
- 25 Center Grove Rd
- 71 Reservoir Ave
- 11 Linwood Ave
- 60 A E Black Well St
- 51 N Morris St
- 166 Millbrook Ave
- 1 Rockridge Terrace
- 335 S Morris St
- 4 Park Heights Ave
- 11 Front St
- 164 E Blackwell St Unit 166