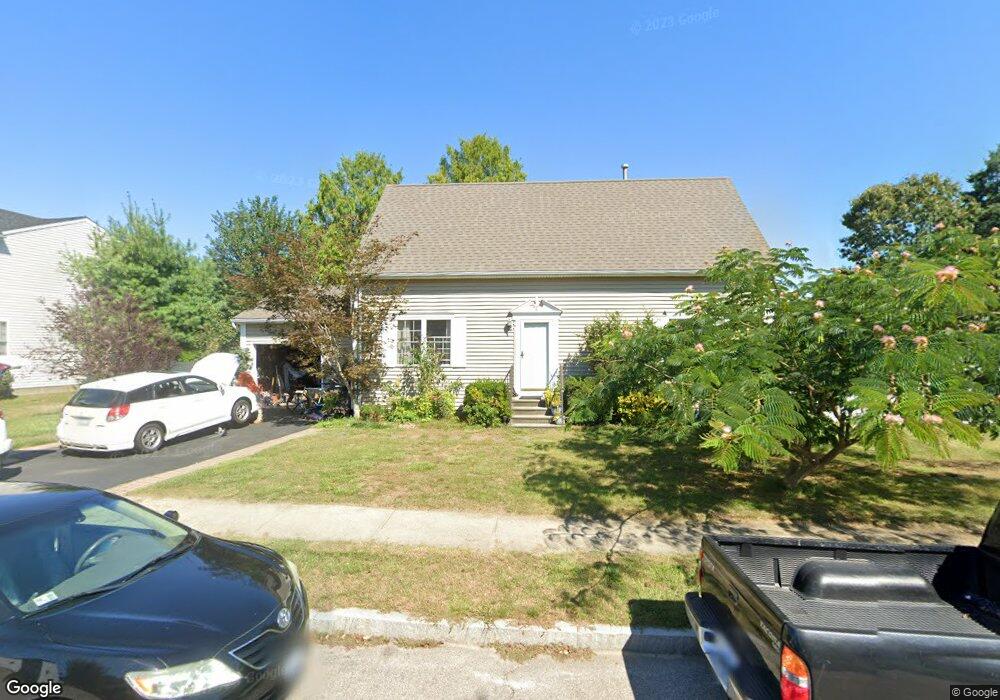
8 Spinnaker Dr Riverside, RI 02915
Riverside NeighborhoodEstimated Value: $600,494 - $699,000
4
Beds
2
Baths
2,770
Sq Ft
$238/Sq Ft
Est. Value
About This Home
This home is located at 8 Spinnaker Dr, Riverside, RI 02915 and is currently estimated at $658,624, approximately $237 per square foot. 8 Spinnaker Dr is a home located in Providence County with nearby schools including East Providence High School, St Luke Elementary School, and St Mary Academy-Bay View.
Ownership History
Date
Name
Owned For
Owner Type
Purchase Details
Closed on
Jan 12, 2006
Sold by
Cendant Mobility Fincl
Bought by
Erickhman Boris and Erickhman Lilia
Current Estimated Value
Purchase Details
Closed on
Sep 1, 2000
Sold by
Jgp Builders Inc
Bought by
Schulz Mark C and Schulz Jennifer
Create a Home Valuation Report for This Property
The Home Valuation Report is an in-depth analysis detailing your home's value as well as a comparison with similar homes in the area
Home Values in the Area
Average Home Value in this Area
Purchase History
| Date | Buyer | Sale Price | Title Company |
|---|---|---|---|
| Erickhman Boris | $375,000 | -- | |
| Cendant Mobilit Fncl C | $375,000 | -- | |
| Schulz Mark C | $192,000 | -- | |
| Erickhman Boris | $375,000 | -- | |
| Schulz Mark C | $192,000 | -- |
Source: Public Records
Mortgage History
| Date | Status | Borrower | Loan Amount |
|---|---|---|---|
| Open | Schulz Mark C | $224,000 | |
| Closed | Schulz Mark C | $246,000 |
Source: Public Records
Tax History
| Year | Tax Paid | Tax Assessment Tax Assessment Total Assessment is a certain percentage of the fair market value that is determined by local assessors to be the total taxable value of land and additions on the property. | Land | Improvement |
|---|---|---|---|---|
| 2025 | $7,130 | $545,500 | $154,400 | $391,100 |
| 2024 | $6,544 | $426,900 | $128,700 | $298,200 |
| 2023 | $6,301 | $426,900 | $128,700 | $298,200 |
| 2022 | $7,129 | $326,100 | $93,100 | $233,000 |
| 2021 | $7,011 | $326,100 | $92,200 | $233,900 |
| 2020 | $6,714 | $326,100 | $92,200 | $233,900 |
| 2019 | $6,529 | $326,100 | $92,200 | $233,900 |
| 2018 | $6,914 | $302,200 | $102,000 | $200,200 |
| 2017 | $6,760 | $302,200 | $102,000 | $200,200 |
| 2016 | $6,727 | $302,200 | $102,000 | $200,200 |
| 2015 | $6,389 | $278,400 | $78,800 | $199,600 |
| 2014 | $6,389 | $278,400 | $78,800 | $199,600 |
Source: Public Records
Map
Nearby Homes
Your Personal Tour Guide
Ask me questions while you tour the home.