
Seller's Agent in 2025
Tricia Largay
Realty of Maine
(207) 852-0397
24 in this area
168 Total Sales
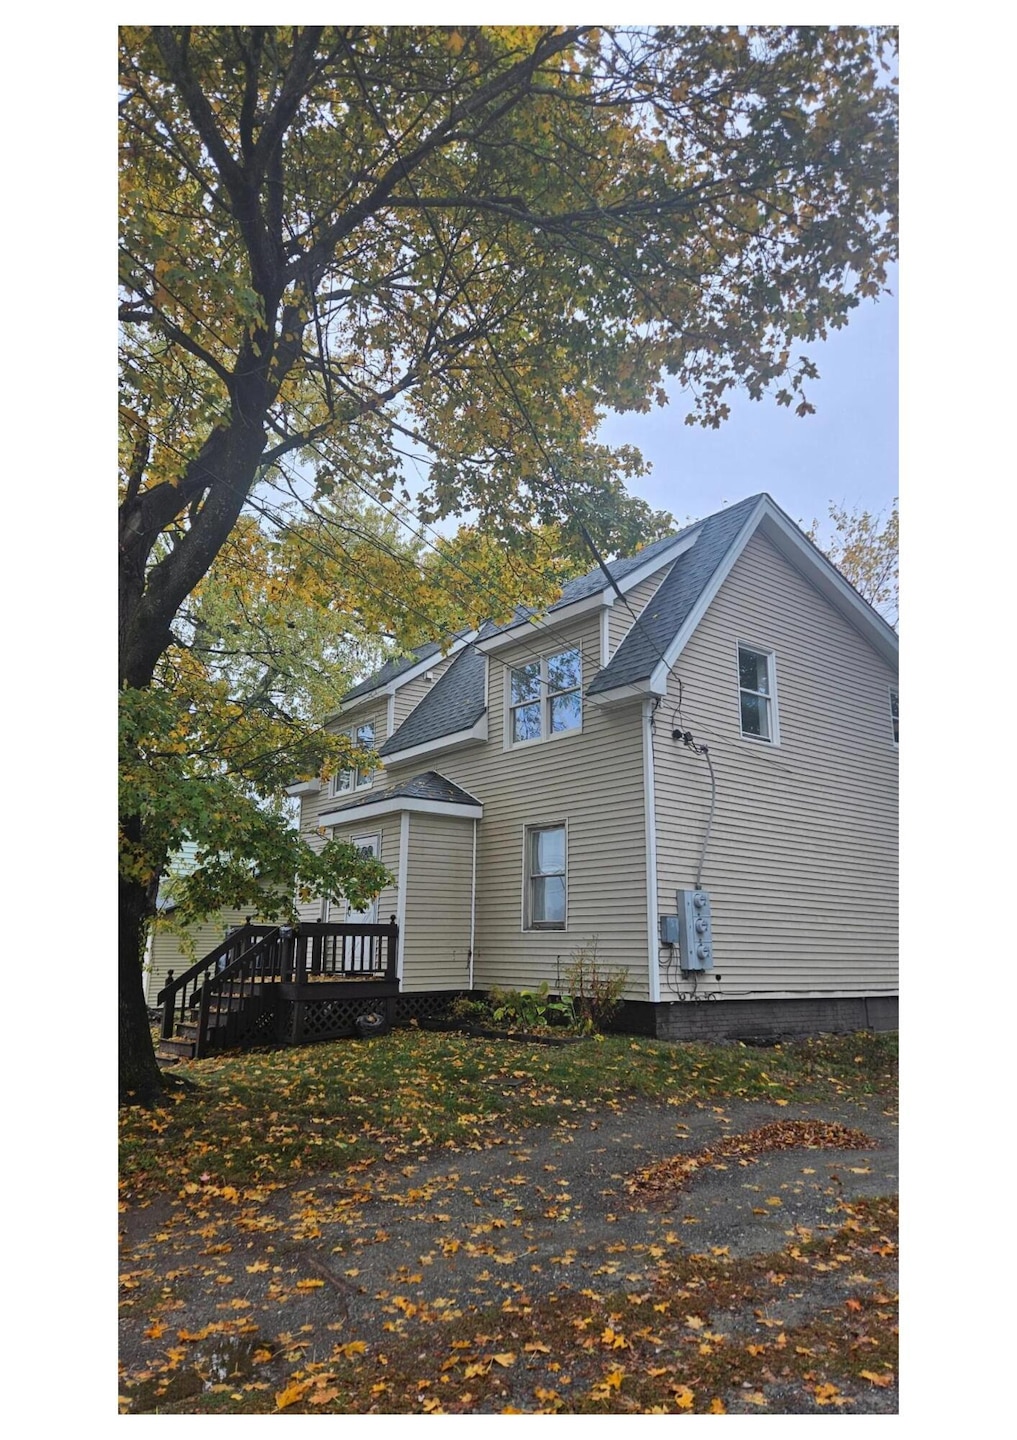
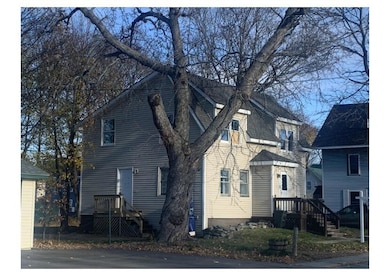
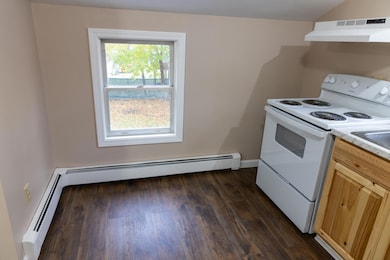
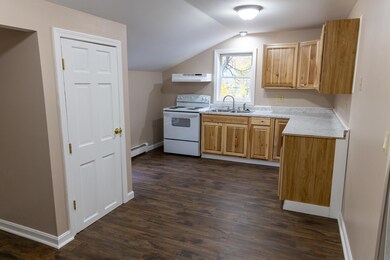
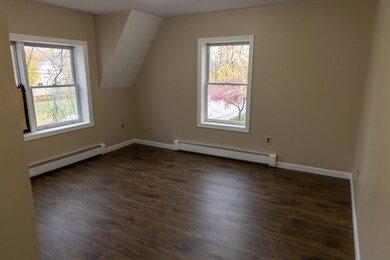
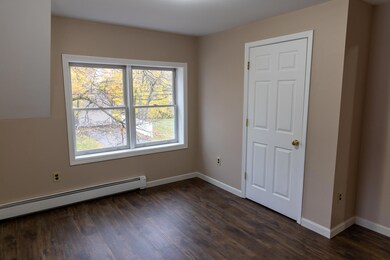
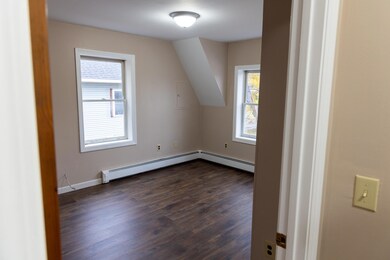
Discover a fantastic investment opportunity in Brewer, Maine, with this well-maintained two-unit property. One of the units has been beautifully remodeled, featuring a brand-new kitchen, new flooring, and a modern coat of paint that enhances its appeal. The property boasts durable vinyl siding and a plethora of windows that allow for an abundance of natural light, creating a warm and inviting atmosphere. Situated on a small lot in-town, this residence offers the convenience of off-street parking. Currently, one unit is vacant, providing a perfect opportunity for owner-occupancy, while the other unit has an established renter, ensuring immediate income. Each unit consists of two bedrooms and one bathroom, making them ideal for many renters looking for comfortable living spaces. Brewer, Maine, is an exceptional place to live, known for its friendly community, excellent schools, and proximity to local amenities such as restaurants, shopping, and a public library. The picturesque surroundings and recreational opportunities nearby make it a desirable location. Owning a two-unit property not only allows you to generate rental income but also offers the flexibility to occupy one unit while the other helps cover your mortgage. This setup can significantly reduce living expenses, making it an attractive option for first-time buyers and seasoned investors alike. With the combination of a charming property, financial benefits, and a vibrant community, this Brewer real estate listing is an exceptional find.
| Date | Type | Sale Price | Title Company |
|---|---|---|---|
| Warranty Deed | $249,000 | -- | |
| Interfamily Deed Transfer | -- | None Available | |
| Interfamily Deed Transfer | -- | None Available |
| Date | Status | Loan Amount | Loan Type |
|---|---|---|---|
| Open | $298,800 | Purchase Money Mortgage | |
| Previous Owner | $105,000 | New Conventional |
| Date | Event | Price | List to Sale | Price per Sq Ft |
|---|---|---|---|---|
| 12/29/2025 12/29/25 | Sold | $249,000 | -3.9% | $150 / Sq Ft |
| 11/19/2025 11/19/25 | Pending | -- | -- | -- |
| 11/18/2025 11/18/25 | For Sale | $259,000 | -- | $156 / Sq Ft |
| Year | Tax Paid | Tax Assessment Tax Assessment Total Assessment is a certain percentage of the fair market value that is determined by local assessors to be the total taxable value of land and additions on the property. | Land | Improvement |
|---|---|---|---|---|
| 2025 | $3,334 | $216,500 | $28,400 | $188,100 |
| 2024 | $3,328 | $177,000 | $28,400 | $148,600 |
| 2023 | $3,240 | $161,200 | $26,400 | $134,800 |
| 2021 | $3,122 | $140,000 | $26,000 | $114,000 |
| 2020 | $2,578 | $113,300 | $26,000 | $87,300 |
| 2019 | $2,370 | $103,100 | $26,000 | $77,100 |
| 2018 | $2,412 | $109,600 | $26,000 | $83,600 |
| 2017 | $2,466 | $109,600 | $26,000 | $83,600 |
| 2016 | $2,359 | $109,600 | $26,000 | $83,600 |
| 2015 | $2,359 | $109,600 | $26,000 | $83,600 |
| 2014 | $2,293 | $109,600 | $26,000 | $83,600 |
| 2013 | $2,230 | $106,600 | $16,100 | $90,500 |
Seller's Agent in 2025
Tricia Largay
Realty of Maine
(207) 852-0397
24 in this area
168 Total Sales
Buyer's Agent in 2025
Paul Cook
Realty of Maine
(207) 942-8003
4 in this area
30 Total Sales
Source: Maine Listings
MLS Number: 1643808
APN: BRER-000028-000000-000016
Disclaimer: Certain information contained herein is derived from information provided by parties other than Homes.com. All information provided is deemed reliable, but is not guaranteed to be accurate and should be independently verified.
![]() Listing data is derived in whole or in part from Maine Real Estate Information System, Inc. (d/b/a Maine Listings) and is for consumers' personal, noncommercial use only. Dimensions are approximate and not guaranteed. All data should be independently verified.
Listing data is derived in whole or in part from Maine Real Estate Information System, Inc. (d/b/a Maine Listings) and is for consumers' personal, noncommercial use only. Dimensions are approximate and not guaranteed. All data should be independently verified.
© 2026 Maine Real Estate Information System, Inc. All Rights Reserved. Equal Housing Opportunity.
Homes.com, LLC, 17600 Laguna Canyon Rd Irvine, CA 92618 (888)-952-6393
![]()
Ask me questions while you tour the home.