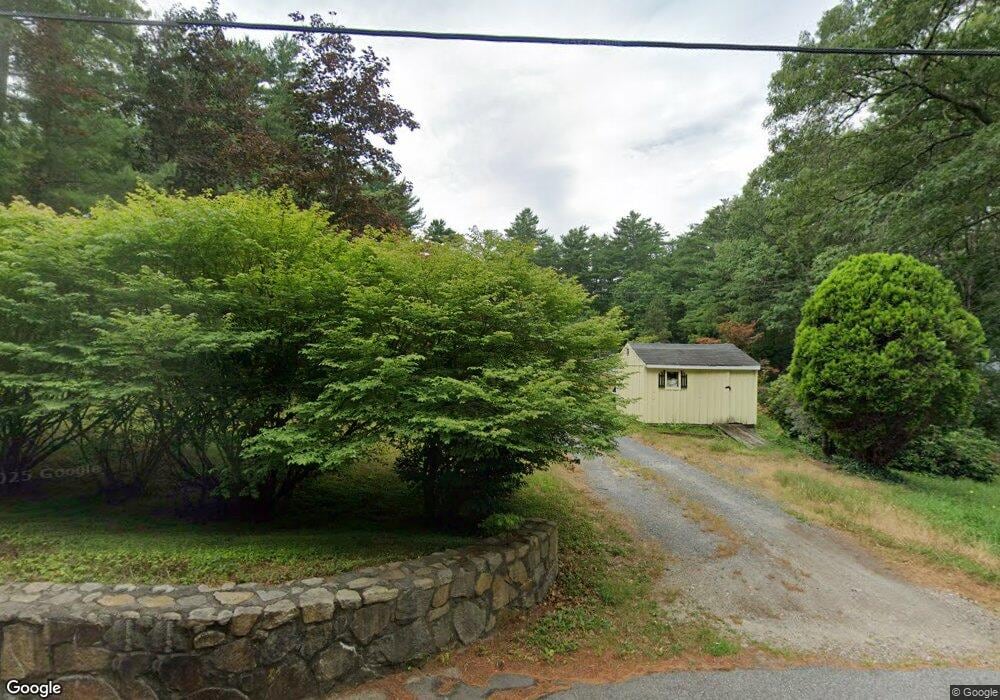
8 Spring St Carver, MA 02330
Estimated Value: $522,000 - $551,842
3
Beds
1
Bath
1,120
Sq Ft
$480/Sq Ft
Est. Value
About This Home
This home is located at 8 Spring St, Carver, MA 02330 and is currently estimated at $537,711, approximately $480 per square foot. 8 Spring St is a home located in Plymouth County with nearby schools including Carver Elementary School, Carver Middle/High School, and Map Academy Charter School.
Ownership History
Date
Name
Owned For
Owner Type
Purchase Details
Closed on
Mar 4, 2005
Sold by
Barker John F W and Barker Janice
Bought by
Geezil Kevin M
Current Estimated Value
Create a Home Valuation Report for This Property
The Home Valuation Report is an in-depth analysis detailing your home's value as well as a comparison with similar homes in the area
Home Values in the Area
Average Home Value in this Area
Purchase History
| Date | Buyer | Sale Price | Title Company |
|---|---|---|---|
| Geezil Kevin M | $280,000 | -- |
Source: Public Records
Mortgage History
| Date | Status | Borrower | Loan Amount |
|---|---|---|---|
| Open | Geezil Kevin M | $260,000 | |
| Closed | Geezil Kevin M | $32,467 | |
| Closed | Geezil Kevin M | $260,000 |
Source: Public Records
Tax History
| Year | Tax Paid | Tax Assessment Tax Assessment Total Assessment is a certain percentage of the fair market value that is determined by local assessors to be the total taxable value of land and additions on the property. | Land | Improvement |
|---|---|---|---|---|
| 2025 | $6,455 | $465,400 | $142,100 | $323,300 |
| 2024 | $6,123 | $432,100 | $139,300 | $292,800 |
| 2023 | $5,972 | $409,300 | $139,300 | $270,000 |
| 2022 | $5,644 | $353,200 | $119,100 | $234,100 |
| 2021 | $5,409 | $319,300 | $106,300 | $213,000 |
| 2020 | $4,879 | $283,800 | $99,400 | $184,400 |
| 2019 | $4,706 | $276,000 | $96,500 | $179,500 |
| 2018 | $4,529 | $256,900 | $96,500 | $160,400 |
| 2017 | $4,373 | $247,200 | $92,800 | $154,400 |
| 2016 | $4,022 | $236,200 | $88,400 | $147,800 |
| 2015 | $3,945 | $231,900 | $88,400 | $143,500 |
| 2014 | $3,931 | $231,100 | $111,800 | $119,300 |
Source: Public Records
Map
Nearby Homes
- 0 Spring St
- 28 Brook St
- 42 Christmas Tree Ln
- 6 Susan Cir
- 6 Twin Pines Ln Unit 6
- 103 Esta Rd
- 11 Brockton Ave
- 241 Carver Rd Unit 7
- 61 Esta Rd
- 13 Pond View Way
- 12 Meeting House Rd
- 89 Silva St
- 44 Meeting House Rd
- 56 Bunnys Rd
- 58 Bunnys Rd
- 14 Mariner's Way Unit 14
- 44 Mariner's Way Unit 44
- 6 Coachman Terrace
- 51 Mariner's Way Unit 51
- 1 Mariner's Way Unit 309
Your Personal Tour Guide
Ask me questions while you tour the home.