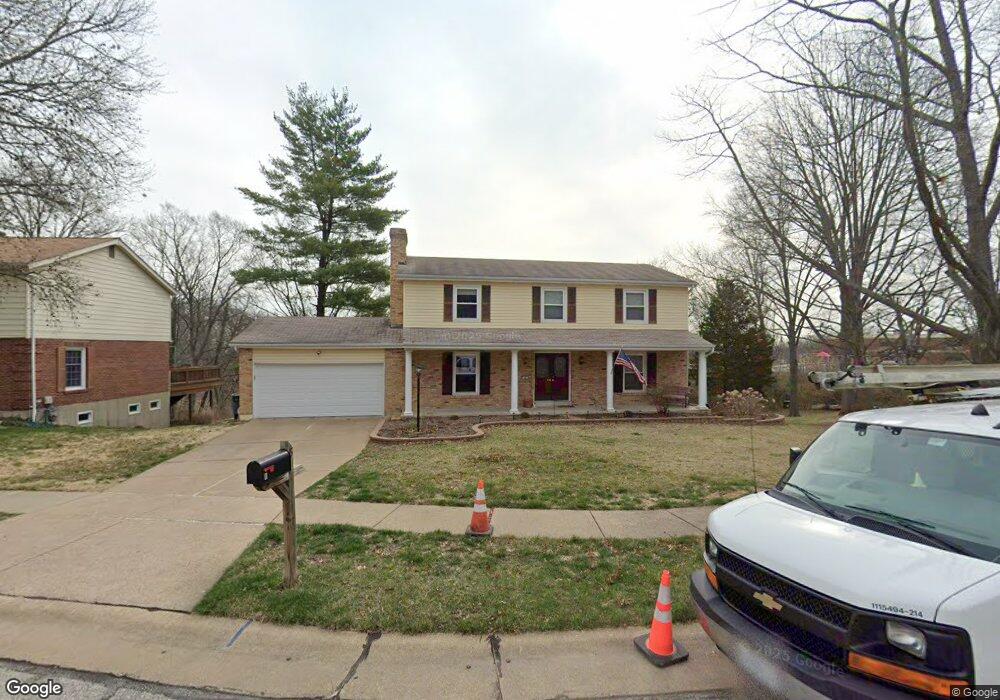
8 Springlake Ct Ballwin, MO 63011
Estimated Value: $454,789 - $496,000
5
Beds
3
Baths
2,240
Sq Ft
$214/Sq Ft
Est. Value
About This Home
This home is located at 8 Springlake Ct, Ballwin, MO 63011 and is currently estimated at $480,197, approximately $214 per square foot. 8 Springlake Ct is a home located in St. Louis County with nearby schools including Henry Elementary School, Parkway West Middle School, and Parkway West High School.
Ownership History
Date
Name
Owned For
Owner Type
Purchase Details
Closed on
Dec 11, 2003
Sold by
Kallaos Christopher and Kallaos Keri
Bought by
Kallaos Christopher S and Kallaos Keri L
Current Estimated Value
Home Financials for this Owner
Home Financials are based on the most recent Mortgage that was taken out on this home.
Original Mortgage
$174,000
Outstanding Balance
$79,881
Interest Rate
5.86%
Mortgage Type
Stand Alone Refi Refinance Of Original Loan
Estimated Equity
$400,316
Purchase Details
Closed on
Mar 29, 2002
Sold by
Eggleston Betty R
Bought by
Kallaos Christopher and Kallaos Keri
Home Financials for this Owner
Home Financials are based on the most recent Mortgage that was taken out on this home.
Original Mortgage
$174,000
Interest Rate
6.8%
Purchase Details
Closed on
Jan 5, 1999
Sold by
Eggleston Betty R
Bought by
Eggleston Betty R and Betty R Eggleston Living Trust
Create a Home Valuation Report for This Property
The Home Valuation Report is an in-depth analysis detailing your home's value as well as a comparison with similar homes in the area
Home Values in the Area
Average Home Value in this Area
Purchase History
| Date | Buyer | Sale Price | Title Company |
|---|---|---|---|
| Kallaos Christopher S | -- | -- | |
| Kallaos Christopher | $219,000 | -- | |
| Eggleston Betty R | -- | -- |
Source: Public Records
Mortgage History
| Date | Status | Borrower | Loan Amount |
|---|---|---|---|
| Open | Kallaos Christopher S | $174,000 | |
| Closed | Kallaos Christopher | $174,000 | |
| Closed | Kallaos Christopher S | $10,001 |
Source: Public Records
Tax History
| Year | Tax Paid | Tax Assessment Tax Assessment Total Assessment is a certain percentage of the fair market value that is determined by local assessors to be the total taxable value of land and additions on the property. | Land | Improvement |
|---|---|---|---|---|
| 2025 | $4,953 | $81,510 | $28,060 | $53,450 |
| 2024 | $4,953 | $76,300 | $26,520 | $49,780 |
| 2023 | $4,953 | $76,300 | $26,520 | $49,780 |
| 2022 | $4,533 | $63,380 | $22,720 | $40,660 |
| 2021 | $4,505 | $63,380 | $22,720 | $40,660 |
| 2020 | $4,507 | $60,610 | $18,920 | $41,690 |
| 2019 | $4,454 | $60,610 | $18,920 | $41,690 |
| 2018 | $3,790 | $47,670 | $17,040 | $30,630 |
| 2017 | $3,746 | $47,670 | $17,040 | $30,630 |
| 2016 | $3,635 | $43,850 | $12,310 | $31,540 |
| 2015 | $3,801 | $43,850 | $12,310 | $31,540 |
| 2014 | $3,504 | $45,090 | $8,780 | $36,310 |
Source: Public Records
Map
Nearby Homes
- 490 Maymont Dr
- 909 Dutch Mill Dr
- 828 Windmill Dr
- 426 Brooktree Dr
- 718 Chancellor Heights Dr
- 502 Iron Lantern Dr
- 724 Clayton Corners Dr
- 203 Morewood Dr
- 1022 Julianna Dr
- 718 Savannah Crossing Way
- 569 Highland Ridge Dr
- 103 Calico Ln
- 277 Oak Path Dr
- 902 Rusticmanor Cir
- 449 Wildwood Pkwy
- 1042 Parkwatch Dr
- 202 Wildbrier Dr
- 114 Lea Meadows Dr
- 242 Aspen Trail Dr
- 14443 Bantry Ln Unit 1
- 9 Springlake Ct
- 7 Springlake Ct
- 10 Springlake Ct
- 4 Springlake Ct
- 6 Springlake Ct
- 5 Springlake Ct
- 2 Springlake Ct
- 11 Springlake Ct
- 710 Henry Ave
- 806 Dutch Mill Dr
- 712 Henry Ave
- 808 Dutch Mill Dr
- 702 Dutch Mill Dr
- 714 Henry Ave
- 804 Dutch Mill Dr
- 12 Springlake Ct
- 810 Dutch Mill Dr
- 716 Henry Ave
- 1 Spring Valley Tbd Ct
- 703 Henry Ave
Your Personal Tour Guide
Ask me questions while you tour the home.