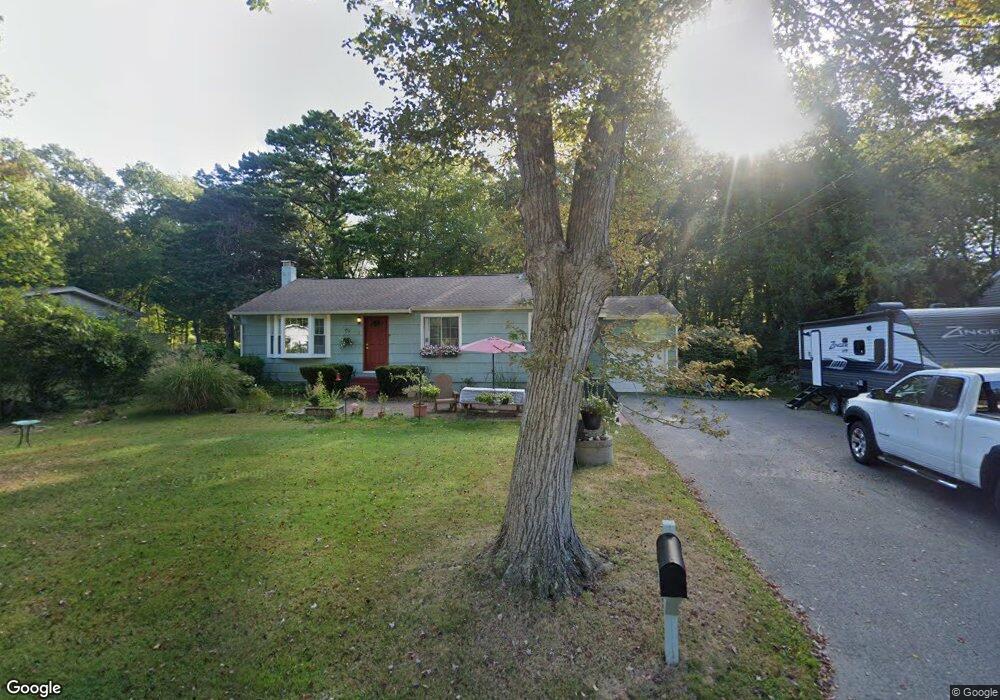
8 Stone Ct Gales Ferry, CT 06335
Estimated Value: $307,000 - $341,000
3
Beds
2
Baths
1,092
Sq Ft
$298/Sq Ft
Est. Value
About This Home
This home is located at 8 Stone Ct, Gales Ferry, CT 06335 and is currently estimated at $324,941, approximately $297 per square foot. 8 Stone Ct is a home located in New London County with nearby schools including Ledyard Middle School, Ledyard High School, and Academy Of St Therese.
Ownership History
Date
Name
Owned For
Owner Type
Purchase Details
Closed on
Jun 23, 2005
Sold by
Roudabush Kirk and Roudabush Natalie
Bought by
Mallory Andrew and Mallory Rhonda
Current Estimated Value
Home Financials for this Owner
Home Financials are based on the most recent Mortgage that was taken out on this home.
Original Mortgage
$228,375
Outstanding Balance
$119,686
Interest Rate
5.82%
Estimated Equity
$205,255
Purchase Details
Closed on
May 21, 2003
Sold by
Sargent Kenneth
Bought by
Roudabush Kirk and Roudabush Natalie
Home Financials for this Owner
Home Financials are based on the most recent Mortgage that was taken out on this home.
Original Mortgage
$155,000
Interest Rate
5.86%
Purchase Details
Closed on
Oct 15, 1991
Sold by
West Byron
Bought by
Sargeant Kenneth
Purchase Details
Closed on
Oct 1, 1987
Sold by
Miller Mary
Bought by
West Byron
Create a Home Valuation Report for This Property
The Home Valuation Report is an in-depth analysis detailing your home's value as well as a comparison with similar homes in the area
Home Values in the Area
Average Home Value in this Area
Purchase History
| Date | Buyer | Sale Price | Title Company |
|---|---|---|---|
| Mallory Andrew | $225,000 | -- | |
| Roudabush Kirk | $155,000 | -- | |
| Sargeant Kenneth | $100,000 | -- | |
| West Byron | $115,200 | -- |
Source: Public Records
Mortgage History
| Date | Status | Borrower | Loan Amount |
|---|---|---|---|
| Open | West Byron | $228,375 | |
| Previous Owner | West Byron | $155,000 | |
| Previous Owner | West Byron | $95,000 |
Source: Public Records
Tax History Compared to Growth
Tax History
| Year | Tax Paid | Tax Assessment Tax Assessment Total Assessment is a certain percentage of the fair market value that is determined by local assessors to be the total taxable value of land and additions on the property. | Land | Improvement |
|---|---|---|---|---|
| 2025 | $5,098 | $137,270 | $44,730 | $92,540 |
| 2024 | $4,833 | $137,270 | $44,730 | $92,540 |
| 2023 | $4,744 | $137,270 | $44,730 | $92,540 |
| 2022 | $4,642 | $137,270 | $44,730 | $92,540 |
| 2021 | $4,596 | $136,780 | $44,730 | $92,050 |
| 2020 | $4,029 | $115,220 | $46,830 | $68,390 |
| 2019 | $4,040 | $115,220 | $46,830 | $68,390 |
| 2018 | $3,951 | $115,220 | $46,830 | $68,390 |
| 2017 | $3,749 | $115,220 | $46,830 | $68,390 |
| 2016 | $3,676 | $115,220 | $46,830 | $68,390 |
| 2015 | $3,503 | $115,220 | $46,830 | $68,390 |
| 2014 | $3,675 | $122,920 | $46,830 | $76,090 |
Source: Public Records
Map
Nearby Homes
- 10 Stone Ct
- 123A Whalehead Rd
- 7 Briarwood Ct
- 16 Marty's Way
- 18 Marty's Way
- 0 Clarks Falls Unit 24089817
- 39 Ash Dr Unit 9
- 11 Marty's Way
- 25 Marty's Way
- 2 Garden Ct
- 5 Bittersweet Dr
- 47 Norman Dr
- 16 Marlene Dr
- 5 Ledgewood Dr
- 145 Massapeag Side Rd
- 15 Drawbridge Rd
- 421 Kitemaug Rd
- 932 Long Cove Rd Unit TRLR 4
- 3 Holdsworth Rd
- 140 Route 12