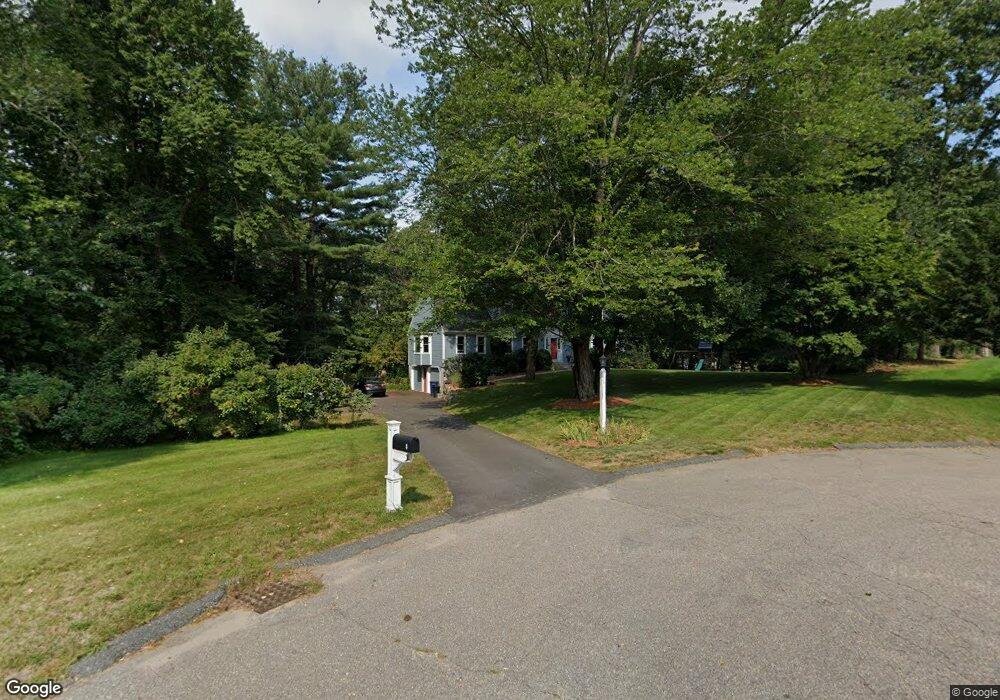
8 Stone End Rd Medway, MA 02053
Estimated Value: $841,000 - $1,362,000
5
Beds
4
Baths
3,010
Sq Ft
$334/Sq Ft
Est. Value
About This Home
This home is located at 8 Stone End Rd, Medway, MA 02053 and is currently estimated at $1,004,119, approximately $333 per square foot. 8 Stone End Rd is a home located in Norfolk County with nearby schools including John D. McGovern Elementary School, Burke-Memorial Elementary, and Medway Middle School.
Ownership History
Date
Name
Owned For
Owner Type
Purchase Details
Closed on
Dec 3, 1992
Sold by
Reed Marsha A
Bought by
Miller William B and Miller June R
Current Estimated Value
Home Financials for this Owner
Home Financials are based on the most recent Mortgage that was taken out on this home.
Original Mortgage
$191,000
Interest Rate
8.22%
Mortgage Type
Purchase Money Mortgage
Create a Home Valuation Report for This Property
The Home Valuation Report is an in-depth analysis detailing your home's value as well as a comparison with similar homes in the area
Home Values in the Area
Average Home Value in this Area
Purchase History
| Date | Buyer | Sale Price | Title Company |
|---|---|---|---|
| Miller William B | $239,000 | -- |
Source: Public Records
Mortgage History
| Date | Status | Borrower | Loan Amount |
|---|---|---|---|
| Open | Miller William B | $104,000 | |
| Open | Miller William B | $181,000 | |
| Closed | Miller William B | $191,000 | |
| Previous Owner | Miller William B | $150,000 |
Source: Public Records
Tax History
| Year | Tax Paid | Tax Assessment Tax Assessment Total Assessment is a certain percentage of the fair market value that is determined by local assessors to be the total taxable value of land and additions on the property. | Land | Improvement |
|---|---|---|---|---|
| 2025 | $10,914 | $765,900 | $345,300 | $420,600 |
| 2024 | $11,029 | $765,900 | $345,300 | $420,600 |
| 2023 | $10,928 | $685,600 | $314,800 | $370,800 |
| 2022 | $9,696 | $572,700 | $234,200 | $338,500 |
| 2021 | $9,723 | $556,900 | $218,900 | $338,000 |
| 2020 | $9,433 | $539,000 | $218,900 | $320,100 |
| 2019 | $8,913 | $525,200 | $210,200 | $315,000 |
| 2018 | $9,047 | $512,300 | $201,500 | $310,800 |
| 2017 | $9,195 | $513,100 | $197,200 | $315,900 |
| 2016 | $9,015 | $497,800 | $181,900 | $315,900 |
| 2015 | $8,837 | $484,500 | $179,700 | $304,800 |
| 2014 | $8,779 | $466,000 | $185,200 | $280,800 |
Source: Public Records
Map
Nearby Homes
- 8 Liberty Rd
- 23 Cedar Farms Rd
- 56 Fisher St
- 3 Nobscott Rd
- 15 Fox Run Rd
- 190-194 E Main St
- 22 Granite St
- 45 Wendy Ln
- 4 Waterfall Ln
- 6 Kingson Ln Unit 2
- 39 West St
- 2 Kingson Ln Unit 2
- 4 Bullard Cir
- 50 Morgans Way
- 3 Thayer Rd
- 6 Freedom Trail
- 35 Woodland Ave Unit 35A
- 16 Oak Tree Dr
- 15 Black Bear Cir Unit 15
- 13 Black Bear Cir Unit 13
Your Personal Tour Guide
Ask me questions while you tour the home.