8 Stone Way Wakefield, MA 01880
Woodville NeighborhoodEstimated Value: $902,000 - $1,244,000
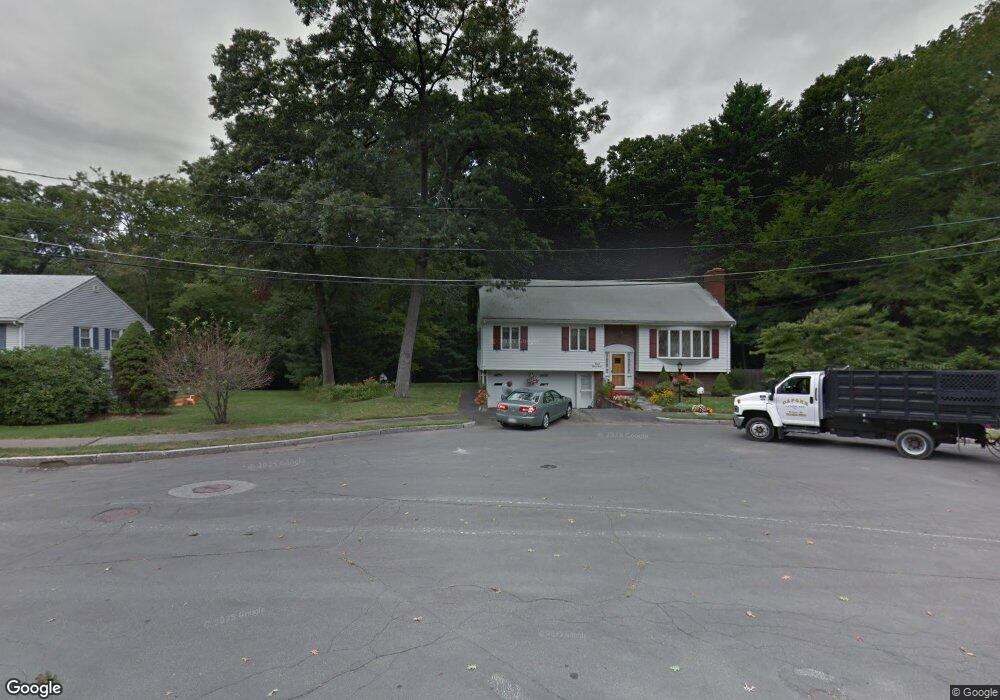
About This Home
This home is located at 8 Stone Way, Wakefield, MA 01880 and is currently estimated at $1,110,050, approximately $280 per square foot. 8 Stone Way is a home located in Middlesex County with nearby schools including Wakefield Memorial High School, Pioneer Charter School Of Science II, and St Joseph School.
Ownership History
We collect this data history from publicly available records. To have your information removed, we recommend requesting removal directly through your county’s website.
Purchase Details
Home Financials for this Owner
Home Financials are based on the most recent Mortgage that was taken out on this home.Home Values in the Area
Average Home Value in this Area
Purchase History
We collect this data history from publicly available records. To have your information removed, we recommend requesting removal directly through your county’s website.
| Date | Buyer | Sale Price | Title Company |
|---|---|---|---|
| $406,000 | -- | ||
| $406,000 | -- |
Mortgage History
We collect this data history from publicly available records. To have your information removed, we recommend requesting removal directly through your county’s website.
| Date | Status | Borrower | Loan Amount |
|---|---|---|---|
| Open | $385,463 | ||
| Closed | $385,463 | ||
| Previous Owner | $30,000 |
Tax History
We collect this data history from publicly available records. To have your information removed, we recommend requesting removal directly through your county’s website.
| Year | Tax Paid | Tax Assessment Tax Assessment Total Assessment is a certain percentage of the fair market value that is determined by local assessors to be the total taxable value of land and additions on the property. | Land | Improvement |
|---|---|---|---|---|
| 2025 | $10,479 | $923,300 | $412,900 | $510,400 |
| 2024 | $10,082 | $896,200 | $400,800 | $495,400 |
| 2023 | $9,734 | $829,800 | $371,100 | $458,700 |
| 2022 | $9,293 | $754,300 | $337,300 | $417,000 |
| 2021 | $9,386 | $737,300 | $313,800 | $423,500 |
| 2020 | $9,026 | $706,800 | $300,800 | $406,000 |
| 2019 | $8,756 | $682,500 | $290,500 | $392,000 |
| 2018 | $8,284 | $639,700 | $272,300 | $367,400 |
| 2017 | $7,938 | $609,200 | $259,300 | $349,900 |
| 2016 | $5,758 | $426,800 | $240,000 | $186,800 |
| 2015 | $5,377 | $398,900 | $224,300 | $174,600 |
| 2014 | $4,939 | $386,500 | $217,300 | $169,200 |
Map
- 33 Reynolds Rd
- 85 Farm St
- 8 Everett St
- 6 Atwood St
- 9 Hart St
- 61 Valley St Unit 1
- 95 Greenwood Ave
- 35 Kendrick Rd
- 4 Wiley Place
- 1 Traverse St Unit E
- 2 Gates Ln Unit B
- 10 Richardson Cir
- 30 Golden Hills Rd
- 234 Water St Unit 205
- 974 Main St Unit 23
- 14 Columbia Rd
- 11 Columbia Rd Unit 8
- 1068 Main St
- 19 Wakefield Ave
- 68 Preston St Unit 9D
Ask me questions while you tour the home.