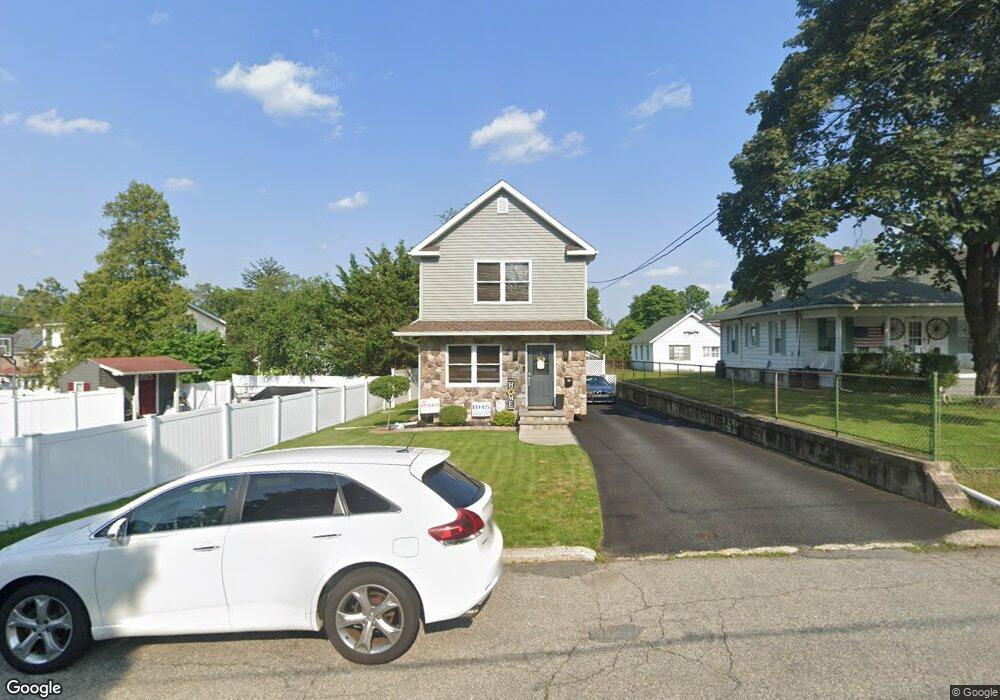
8 Summit Ave Butler, NJ 07405
Estimated Value: $449,000 - $468,000
--
Bed
--
Bath
1,332
Sq Ft
$344/Sq Ft
Est. Value
About This Home
This home is located at 8 Summit Ave, Butler, NJ 07405 and is currently estimated at $457,895, approximately $343 per square foot. 8 Summit Ave is a home located in Morris County with nearby schools including Aaron Decker School, Richard Butler School, and Apple Montessori Schools and Camps - Kinnelon.
Ownership History
Date
Name
Owned For
Owner Type
Purchase Details
Closed on
Mar 2, 2016
Sold by
Arnesen Diane M
Bought by
Fletcher Andrew and Fletcher Deborah
Current Estimated Value
Home Financials for this Owner
Home Financials are based on the most recent Mortgage that was taken out on this home.
Original Mortgage
$289,792
Outstanding Balance
$229,369
Interest Rate
3.65%
Mortgage Type
VA
Estimated Equity
$228,526
Purchase Details
Closed on
Apr 22, 2015
Sold by
Fox Mary and Estate Of Gilson Gary Cruts
Bought by
Arnessen Diane M
Create a Home Valuation Report for This Property
The Home Valuation Report is an in-depth analysis detailing your home's value as well as a comparison with similar homes in the area
Home Values in the Area
Average Home Value in this Area
Purchase History
| Date | Buyer | Sale Price | Title Company |
|---|---|---|---|
| Fletcher Andrew | $283,000 | None Available | |
| Arnessen Diane M | $100,000 | Attorney |
Source: Public Records
Mortgage History
| Date | Status | Borrower | Loan Amount |
|---|---|---|---|
| Open | Fletcher Andrew | $289,792 |
Source: Public Records
Tax History Compared to Growth
Tax History
| Year | Tax Paid | Tax Assessment Tax Assessment Total Assessment is a certain percentage of the fair market value that is determined by local assessors to be the total taxable value of land and additions on the property. | Land | Improvement |
|---|---|---|---|---|
| 2025 | $7,666 | $321,800 | $177,000 | $144,800 |
| 2024 | $7,986 | $307,000 | $172,500 | $134,500 |
| 2023 | $7,986 | $300,900 | $172,000 | $128,900 |
| 2022 | $6,422 | $266,500 | $147,000 | $119,500 |
| 2021 | $6,422 | $167,500 | $101,200 | $66,300 |
| 2020 | $6,258 | $167,500 | $101,200 | $66,300 |
| 2019 | $6,120 | $167,500 | $101,200 | $66,300 |
| 2018 | $6,042 | $167,500 | $101,200 | $66,300 |
| 2017 | $5,888 | $167,500 | $101,200 | $66,300 |
| 2016 | $4,588 | $134,000 | $101,200 | $32,800 |
| 2015 | $4,514 | $134,000 | $101,200 | $32,800 |
| 2014 | $4,375 | $134,000 | $101,200 | $32,800 |
Source: Public Records
Map
Nearby Homes