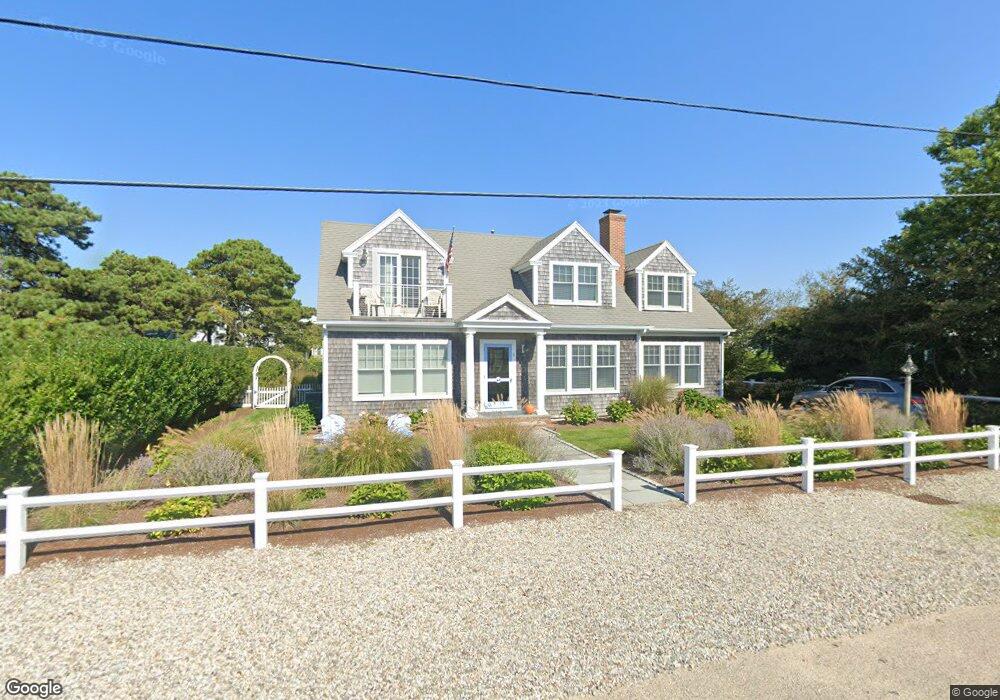
8 Surfside Rd West Dennis, MA 02670
West Dennis NeighborhoodEstimated Value: $1,316,000 - $1,680,000
3
Beds
1
Bath
1,001
Sq Ft
$1,543/Sq Ft
Est. Value
About This Home
This home is located at 8 Surfside Rd, West Dennis, MA 02670 and is currently estimated at $1,544,845, approximately $1,543 per square foot. 8 Surfside Rd is a home located in Barnstable County with nearby schools including Dennis-Yarmouth Regional High School and St. Pius X. School.
Ownership History
Date
Name
Owned For
Owner Type
Purchase Details
Closed on
Jan 17, 1997
Sold by
Halloran John B and Halloran Mary Jane
Bought by
Corcoran Thomas J and Corcoran Maureen P
Current Estimated Value
Home Financials for this Owner
Home Financials are based on the most recent Mortgage that was taken out on this home.
Original Mortgage
$118,000
Interest Rate
7.36%
Mortgage Type
Purchase Money Mortgage
Create a Home Valuation Report for This Property
The Home Valuation Report is an in-depth analysis detailing your home's value as well as a comparison with similar homes in the area
Home Values in the Area
Average Home Value in this Area
Purchase History
| Date | Buyer | Sale Price | Title Company |
|---|---|---|---|
| Corcoran Thomas J | $148,000 | -- |
Source: Public Records
Mortgage History
| Date | Status | Borrower | Loan Amount |
|---|---|---|---|
| Open | Corcoran Thomas J | $117,000 | |
| Closed | Corcoran Thomas J | $118,000 |
Source: Public Records
Tax History
| Year | Tax Paid | Tax Assessment Tax Assessment Total Assessment is a certain percentage of the fair market value that is determined by local assessors to be the total taxable value of land and additions on the property. | Land | Improvement |
|---|---|---|---|---|
| 2025 | $6,173 | $1,425,700 | $476,600 | $949,100 |
| 2024 | $6,110 | $1,391,800 | $458,400 | $933,400 |
| 2023 | $5,954 | $1,275,000 | $416,700 | $858,300 |
| 2022 | $5,724 | $1,022,100 | $375,400 | $646,700 |
| 2021 | $5,212 | $864,300 | $334,500 | $529,800 |
| 2020 | $5,120 | $839,300 | $334,500 | $504,800 |
| 2019 | $4,766 | $772,500 | $328,000 | $444,500 |
| 2018 | $4,697 | $740,900 | $312,200 | $428,700 |
| 2017 | $4,557 | $740,900 | $312,200 | $428,700 |
| 2016 | $4,623 | $707,900 | $343,500 | $364,400 |
| 2015 | $4,531 | $707,900 | $343,500 | $364,400 |
| 2014 | $4,422 | $696,400 | $343,500 | $352,900 |
Source: Public Records
Map
Nearby Homes
Your Personal Tour Guide
Ask me questions while you tour the home.