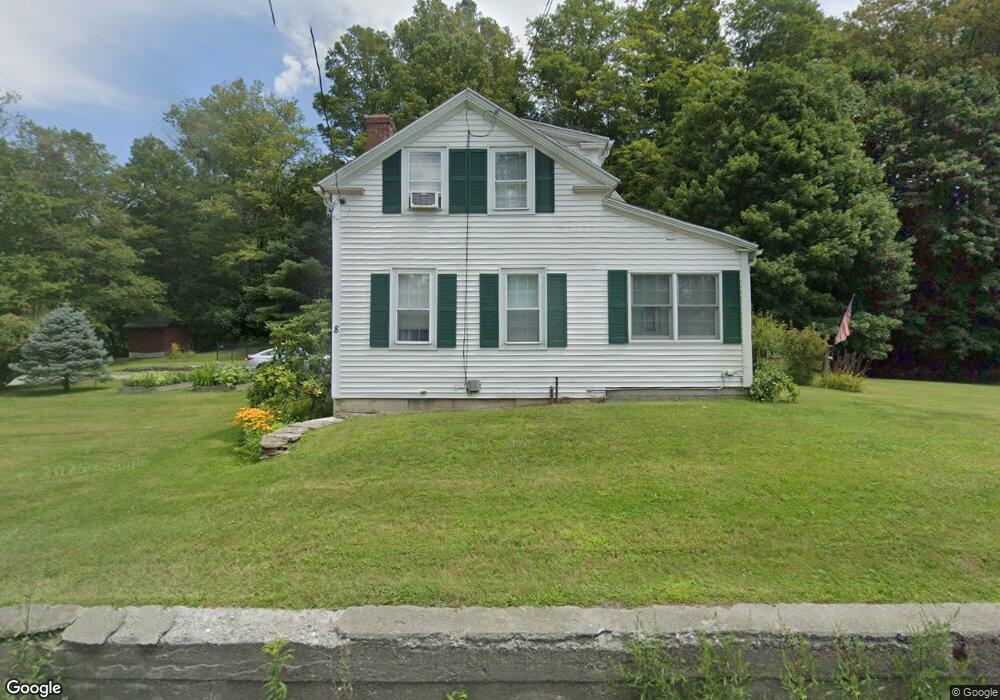
8 Swamp West Stockbridge, MA 01266
Estimated Value: $505,933 - $750,000
3
Beds
2
Baths
2,363
Sq Ft
$250/Sq Ft
Est. Value
About This Home
This home is located at 8 Swamp, West Stockbridge, MA 01266 and is currently estimated at $590,983, approximately $250 per square foot. 8 Swamp is a home located in Berkshire County with nearby schools including Muddy Brook Regional Elementary School, W.E.B Du Bois Regional Middle School, and Monument Mountain Regional High School.
Ownership History
Date
Name
Owned For
Owner Type
Purchase Details
Closed on
Sep 6, 2016
Sold by
Harrigan Judith A
Bought by
Mcdermott Christine E
Current Estimated Value
Purchase Details
Closed on
Dec 30, 2014
Sold by
Harrigan Judith A
Bought by
Harrigan Judith A and Mcdermott Christine E
Purchase Details
Closed on
Jan 11, 2007
Sold by
Mcdermott Marjorie A and Harrigan Judith A
Bought by
Harrigan Judith A
Create a Home Valuation Report for This Property
The Home Valuation Report is an in-depth analysis detailing your home's value as well as a comparison with similar homes in the area
Home Values in the Area
Average Home Value in this Area
Purchase History
| Date | Buyer | Sale Price | Title Company |
|---|---|---|---|
| Mcdermott Christine E | -- | -- | |
| Harrigan Judith A | -- | -- | |
| Harrigan Judith A | -- | -- |
Source: Public Records
Tax History Compared to Growth
Tax History
| Year | Tax Paid | Tax Assessment Tax Assessment Total Assessment is a certain percentage of the fair market value that is determined by local assessors to be the total taxable value of land and additions on the property. | Land | Improvement |
|---|---|---|---|---|
| 2025 | $4,738 | $492,500 | $85,000 | $407,500 |
| 2024 | $4,495 | $469,200 | $75,000 | $394,200 |
| 2023 | $4,516 | $438,000 | $71,400 | $366,600 |
| 2022 | $4,616 | $367,500 | $71,400 | $296,100 |
| 2021 | $4,252 | $305,700 | $71,400 | $234,300 |
| 2020 | $4,011 | $305,700 | $71,400 | $234,300 |
| 2019 | $3,709 | $305,800 | $71,400 | $234,400 |
| 2018 | $3,709 | $305,800 | $71,400 | $234,400 |
| 2017 | $3,816 | $305,800 | $71,400 | $234,400 |
| 2016 | $3,771 | $305,800 | $71,400 | $234,400 |
| 2015 | $3,621 | $305,800 | $71,400 | $234,400 |
| 2014 | $3,400 | $305,800 | $71,400 | $234,400 |
Source: Public Records
Map
Nearby Homes
- 3 & 5 Swamp Rd
- 4 Main St
- 29 Main St
- 35 Main St
- 19 Washington Square
- 21 Stockbridge Rd
- 45 Swamp
- 5 Silver Mine Ln
- 7 Silver Mine Ln
- 17 Iron Mine Rd
- 51 Albany Rd
- 76 Lenox Rd
- 0 Lenox Rd Unit 246122
- 30 Great Barrington Rd
- 0 Furnace Rd
- 2345 Swamp Rd
- 2801 State Rd
- 206 Stevens Glen Rd
- 1 Old Tree Farm Rd
- 2738 State Rd