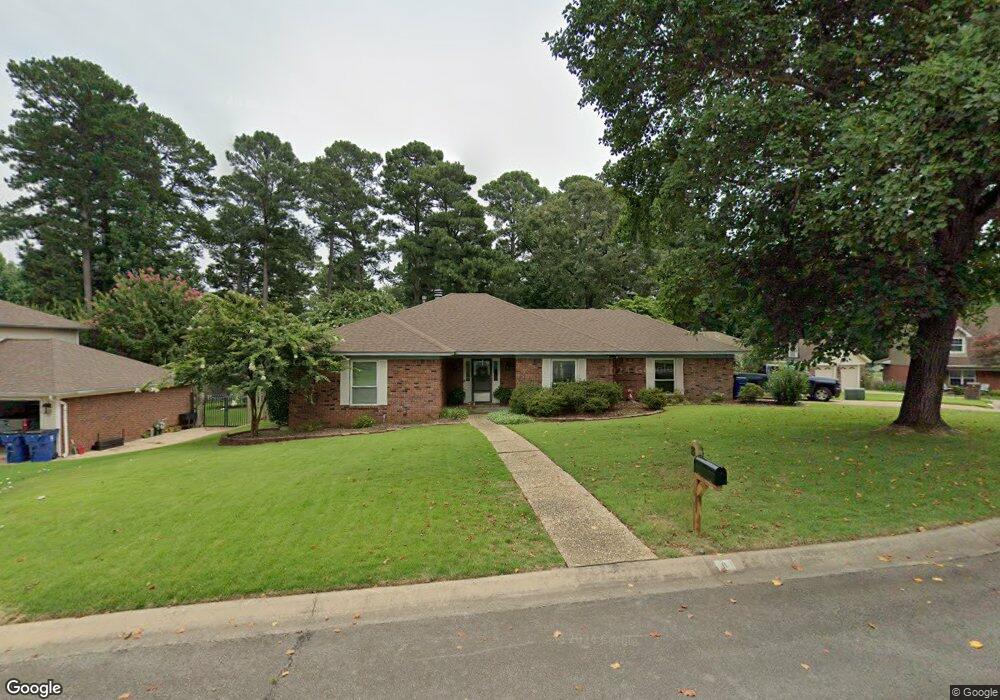
8 Tara Cove Maumelle, AR 72113
Estimated Value: $245,221 - $275,000
--
Bed
2
Baths
1,873
Sq Ft
$142/Sq Ft
Est. Value
About This Home
This home is located at 8 Tara Cove, Maumelle, AR 72113 and is currently estimated at $265,805, approximately $141 per square foot. 8 Tara Cove is a home located in Pulaski County with nearby schools including Crystal Hill Elementary School, Maumelle Middle School, and Maumelle High School.
Ownership History
Date
Name
Owned For
Owner Type
Purchase Details
Closed on
Mar 8, 2012
Sold by
Hornaday Steven J
Bought by
Hornaday Steven J and Hornaday Christy N
Current Estimated Value
Home Financials for this Owner
Home Financials are based on the most recent Mortgage that was taken out on this home.
Original Mortgage
$152,000
Outstanding Balance
$17,667
Interest Rate
3.2%
Mortgage Type
New Conventional
Estimated Equity
$248,138
Purchase Details
Closed on
May 31, 2006
Sold by
Huddleston Deanna Shumard
Bought by
Hornaday Steven J
Home Financials for this Owner
Home Financials are based on the most recent Mortgage that was taken out on this home.
Original Mortgage
$132,800
Interest Rate
6.75%
Mortgage Type
Purchase Money Mortgage
Purchase Details
Closed on
Jan 15, 2001
Sold by
Huddleston Deanna Shumard
Bought by
Huddleston Deanna Shumard
Create a Home Valuation Report for This Property
The Home Valuation Report is an in-depth analysis detailing your home's value as well as a comparison with similar homes in the area
Home Values in the Area
Average Home Value in this Area
Purchase History
| Date | Buyer | Sale Price | Title Company |
|---|---|---|---|
| Hornaday Steven J | -- | Lenders Title Company | |
| Hornaday Steven J | $166,000 | Realty Title | |
| Huddleston Deanna Shumard | -- | -- |
Source: Public Records
Mortgage History
| Date | Status | Borrower | Loan Amount |
|---|---|---|---|
| Open | Hornaday Steven J | $152,000 | |
| Closed | Hornaday Steven J | $132,800 |
Source: Public Records
Tax History Compared to Growth
Tax History
| Year | Tax Paid | Tax Assessment Tax Assessment Total Assessment is a certain percentage of the fair market value that is determined by local assessors to be the total taxable value of land and additions on the property. | Land | Improvement |
|---|---|---|---|---|
| 2025 | $2,361 | $41,933 | $6,200 | $35,733 |
| 2024 | $2,548 | $41,933 | $6,200 | $35,733 |
| 2023 | $2,548 | $41,933 | $6,200 | $35,733 |
| 2022 | $2,177 | $41,933 | $6,200 | $35,733 |
| 2021 | $2,317 | $36,830 | $8,000 | $28,830 |
| 2020 | $1,942 | $36,830 | $8,000 | $28,830 |
| 2019 | $1,942 | $36,830 | $8,000 | $28,830 |
| 2018 | $1,967 | $36,830 | $8,000 | $28,830 |
| 2017 | $1,967 | $36,830 | $8,000 | $28,830 |
| 2016 | $1,972 | $36,910 | $6,780 | $30,130 |
| 2015 | $2,086 | $36,188 | $6,780 | $29,408 |
| 2014 | $2,086 | $33,168 | $6,780 | $26,388 |
Source: Public Records
Map
Nearby Homes
- 23 Kingshill Cove
- 30 Belle River Cove
- 24 Yazoo Cir
- 34 Riverwood Cove
- 26 Hogan Dr
- 41 Norfork Dr
- 111 Orleans Dr
- 6 Masters Place Dr
- 26 Norfork Dr
- 7 Fairway Dr
- 107 Nemours Ct
- 24 Fairway Woods Cir
- 167 Calais Dr
- 20 Fairway Woods Cir
- 114 Calais Dr
- 112 Turtle Creek Cove
- 225 Country Club Parkway (24 Units)
- 5 Crystal Mountain Dr
- 117 Marseille Dr
- 15 Par Dr
- 6 Tara Cove
- 10 Tara Cove
- 16 Hornrimme Place
- 12 Tara Cove
- 14 Hornrimme Place
- 1 Tara Ct
- 7 Tara Cove
- 11 Tara Cove
- 9 Tara Cove
- 3 Tara Ct
- 12 Hornrimme Place
- 18 Hornrimme Place
- 4 Tara Ct
- 5 Tara Ct
- 33 Nancy Lopez Ct
- 10 Hornrimme Place
- 3 Crown Mountain Ct
- 4 Crown Mountain Ct
- 15 Hornrimme Place
- 19 Hornrimme Place