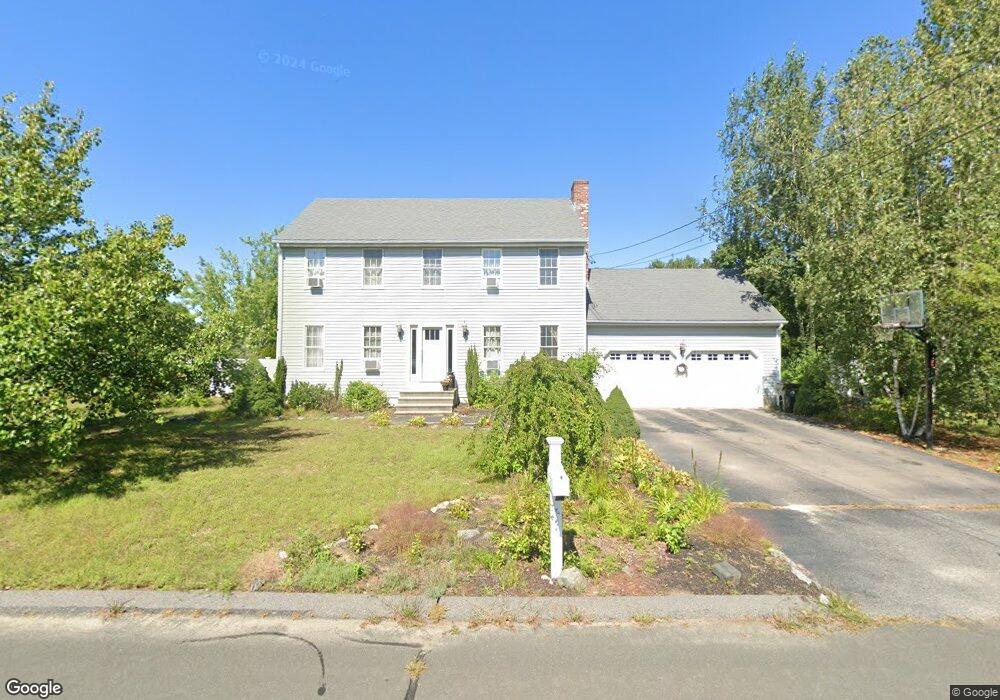
8 Taylor Rd Bellingham, MA 02019
Estimated Value: $589,076 - $703,000
3
Beds
2
Baths
1,728
Sq Ft
$369/Sq Ft
Est. Value
About This Home
This home is located at 8 Taylor Rd, Bellingham, MA 02019 and is currently estimated at $637,269, approximately $368 per square foot. 8 Taylor Rd is a home located in Norfolk County with nearby schools including Joseph F. DiPietro Elementary, Bellingham High School, and Rise Prep Mayoral Academy Middle School.
Ownership History
Date
Name
Owned For
Owner Type
Purchase Details
Closed on
Jan 15, 1999
Sold by
Bertone Michael
Bought by
Compton Robert F and Compton Monica A
Current Estimated Value
Home Financials for this Owner
Home Financials are based on the most recent Mortgage that was taken out on this home.
Original Mortgage
$160,000
Interest Rate
6.7%
Mortgage Type
Purchase Money Mortgage
Purchase Details
Closed on
Oct 30, 1998
Sold by
Gracewood Dev Corp
Bought by
Bertone Michael
Home Financials for this Owner
Home Financials are based on the most recent Mortgage that was taken out on this home.
Original Mortgage
$150,000
Interest Rate
6.68%
Mortgage Type
Purchase Money Mortgage
Create a Home Valuation Report for This Property
The Home Valuation Report is an in-depth analysis detailing your home's value as well as a comparison with similar homes in the area
Home Values in the Area
Average Home Value in this Area
Purchase History
| Date | Buyer | Sale Price | Title Company |
|---|---|---|---|
| Compton Robert F | $204,900 | -- | |
| Bertone Michael | $74,000 | -- |
Source: Public Records
Mortgage History
| Date | Status | Borrower | Loan Amount |
|---|---|---|---|
| Open | Bertone Michael | $154,000 | |
| Closed | Bertone Michael | $160,000 | |
| Previous Owner | Bertone Michael | $150,000 |
Source: Public Records
Tax History
| Year | Tax Paid | Tax Assessment Tax Assessment Total Assessment is a certain percentage of the fair market value that is determined by local assessors to be the total taxable value of land and additions on the property. | Land | Improvement |
|---|---|---|---|---|
| 2025 | $6,976 | $555,400 | $175,500 | $379,900 |
| 2024 | $6,699 | $520,900 | $160,300 | $360,600 |
| 2023 | $6,456 | $494,700 | $152,600 | $342,100 |
| 2022 | $6,378 | $453,000 | $130,100 | $322,900 |
| 2021 | $6,160 | $427,500 | $130,100 | $297,400 |
| 2020 | $5,795 | $407,500 | $130,100 | $277,400 |
| 2019 | $5,668 | $398,900 | $130,100 | $268,800 |
| 2018 | $5,346 | $371,000 | $126,600 | $244,400 |
| 2017 | $5,191 | $362,000 | $126,600 | $235,400 |
| 2016 | $5,099 | $356,800 | $135,300 | $221,500 |
| 2015 | $4,896 | $343,600 | $130,100 | $213,500 |
| 2014 | $4,927 | $336,100 | $127,500 | $208,600 |
Source: Public Records
Map
Nearby Homes
- 101 Pine Grove Ave
- 21 Irving St
- 31 S Main St
- 66 Newland Ave
- 70 Oswego St
- 194 Paine St
- 61 Lawrence St
- 202 Paine St
- 14 Little Tree Ln
- 24 Palmetto Dr Unit 24
- 21 Palmetto Dr Unit 21
- 23 Palmetto Dr Unit 23
- 9 Brookfield Ln
- 1088 Diamond Hill Rd
- 7 Theresa Marie Ave
- 89 Saint Agnes Ave
- 178 Saint Louis Ave
- 9 Pebble Cir Unit 9
- 188 Saint Louis Ave
- Lot 2 Pulaski Blvd
Your Personal Tour Guide
Ask me questions while you tour the home.