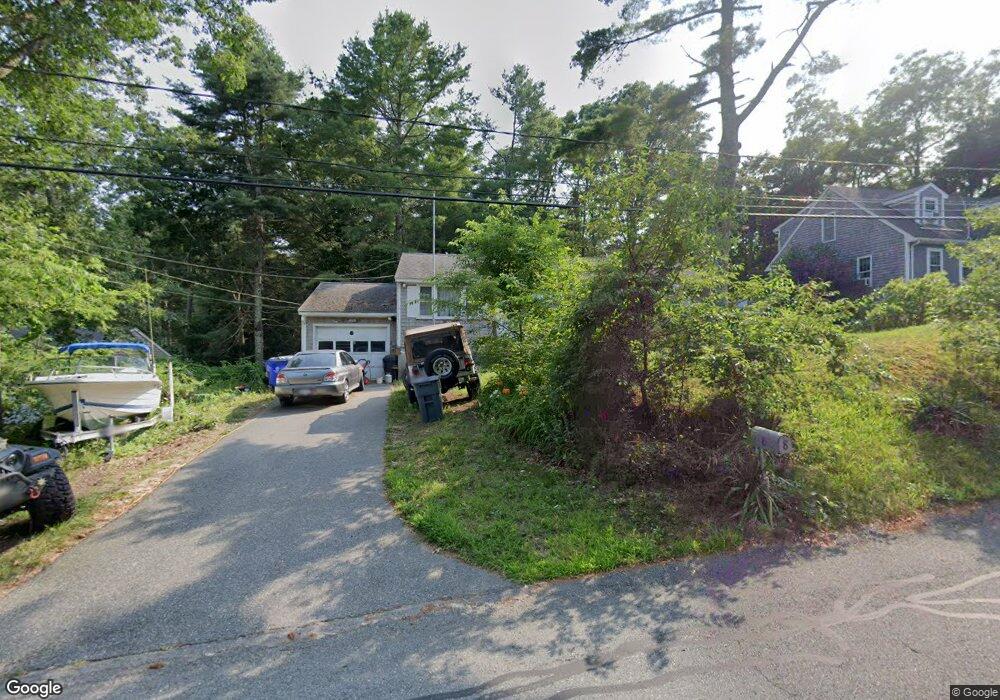
8 Thom Ave Bourne, MA 2532
Monument Beach NeighborhoodEstimated Value: $488,563 - $524,000
3
Beds
1
Bath
1,008
Sq Ft
$503/Sq Ft
Est. Value
About This Home
This home is located at 8 Thom Ave, Bourne, MA 2532 and is currently estimated at $506,891, approximately $502 per square foot. 8 Thom Ave is a home located in Barnstable County with nearby schools including Bourne High School, Cadence Academy Preschool - Bourne, and St Margaret Regional School.
Ownership History
Date
Name
Owned For
Owner Type
Purchase Details
Closed on
Sep 21, 2015
Sold by
Gotovich Francis A and Gotovich Catherine L
Bought by
Cohen Michael J
Current Estimated Value
Home Financials for this Owner
Home Financials are based on the most recent Mortgage that was taken out on this home.
Original Mortgage
$178,500
Interest Rate
3.94%
Mortgage Type
New Conventional
Purchase Details
Closed on
Apr 27, 2012
Sold by
Gotovich Ft and Gotovich
Bought by
Gotovich Francis A and Gotovich Catherine L
Create a Home Valuation Report for This Property
The Home Valuation Report is an in-depth analysis detailing your home's value as well as a comparison with similar homes in the area
Home Values in the Area
Average Home Value in this Area
Purchase History
| Date | Buyer | Sale Price | Title Company |
|---|---|---|---|
| Cohen Michael J | $210,000 | -- | |
| Cohen Michael J | $210,000 | -- | |
| Gotovich Francis A | -- | -- | |
| Gotovich Francis A | -- | -- |
Source: Public Records
Mortgage History
| Date | Status | Borrower | Loan Amount |
|---|---|---|---|
| Closed | Cohen Michael J | $178,500 |
Source: Public Records
Tax History
| Year | Tax Paid | Tax Assessment Tax Assessment Total Assessment is a certain percentage of the fair market value that is determined by local assessors to be the total taxable value of land and additions on the property. | Land | Improvement |
|---|---|---|---|---|
| 2025 | $3,047 | $390,200 | $186,800 | $203,400 |
| 2024 | $2,979 | $371,500 | $177,900 | $193,600 |
| 2023 | $2,896 | $328,700 | $157,400 | $171,300 |
| 2022 | $2,778 | $275,300 | $139,300 | $136,000 |
| 2021 | $2,699 | $250,600 | $126,800 | $123,800 |
| 2020 | $2,614 | $243,400 | $125,600 | $117,800 |
| 2019 | $2,489 | $236,800 | $125,600 | $111,200 |
| 2018 | $2,273 | $215,700 | $113,900 | $101,800 |
| 2017 | $2,201 | $213,700 | $112,900 | $100,800 |
| 2016 | $2,122 | $208,900 | $112,900 | $96,000 |
| 2015 | $2,104 | $208,900 | $112,900 | $96,000 |
Source: Public Records
Map
Nearby Homes
- 566 Shore Rd
- 203 County Rd
- 16 Amberwood Ct
- 20 Colony Ave
- 5 Harbor Hill Dr
- 4 Harbor Hill Dr
- 12 Turnberry Rd Unit 12
- 13 Laurel Hill Ct
- 2 Applewood Ct
- 14 Navajo Rd
- 5 Sea Knoll Ct
- 4 Hollyhock Knoll Ct Unit 4
- 4 Hollyhock Knoll Ct Unit 4
- 709 County Rd
- 5 Zoli Ln
- 35 Benedict Rd
- 3 1st St
- 254 Barlows Landing Rd
- 3 4th Ave
- 7 4th Ave
Your Personal Tour Guide
Ask me questions while you tour the home.