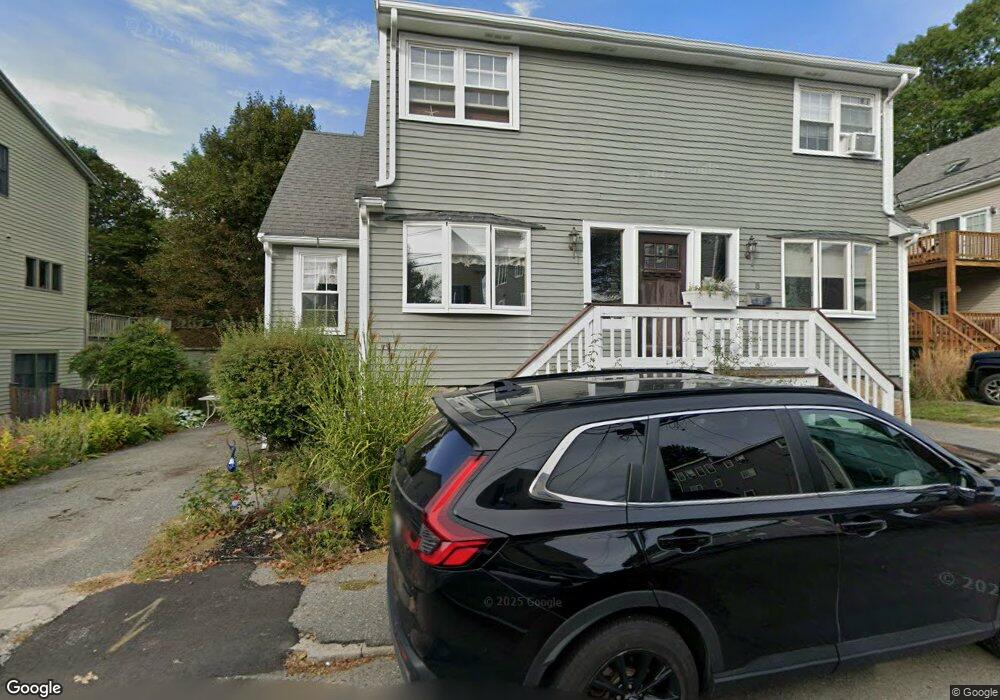
8 Traverse St Gloucester, MA 01930
East Gloucester NeighborhoodEstimated Value: $722,392 - $921,000
4
Beds
2
Baths
1,866
Sq Ft
$439/Sq Ft
Est. Value
About This Home
This home is located at 8 Traverse St, Gloucester, MA 01930 and is currently estimated at $819,598, approximately $439 per square foot. 8 Traverse St is a home located in Essex County with nearby schools including East Gloucester Elementary School, Ralph B O'maley Middle School, and Gloucester High School.
Ownership History
Date
Name
Owned For
Owner Type
Purchase Details
Closed on
Dec 16, 2020
Sold by
Philbrook Kim L and Philbrook Rosemarie A
Bought by
Sheahan Kacia L and Philbrook Tyler R
Current Estimated Value
Purchase Details
Closed on
Oct 1, 1982
Bought by
Philbrook Kim L and Philbrook Rosemary
Create a Home Valuation Report for This Property
The Home Valuation Report is an in-depth analysis detailing your home's value as well as a comparison with similar homes in the area
Home Values in the Area
Average Home Value in this Area
Purchase History
| Date | Buyer | Sale Price | Title Company |
|---|---|---|---|
| Sheahan Kacia L | -- | None Available | |
| Philbrook Kim L | $65,000 | -- |
Source: Public Records
Mortgage History
| Date | Status | Borrower | Loan Amount |
|---|---|---|---|
| Previous Owner | Philbrook Kim L | $282,000 | |
| Previous Owner | Philbrook Kim L | $300,000 |
Source: Public Records
Tax History
| Year | Tax Paid | Tax Assessment Tax Assessment Total Assessment is a certain percentage of the fair market value that is determined by local assessors to be the total taxable value of land and additions on the property. | Land | Improvement |
|---|---|---|---|---|
| 2025 | $5,999 | $617,200 | $197,100 | $420,100 |
| 2024 | $5,907 | $607,100 | $187,700 | $419,400 |
| 2023 | $5,654 | $533,900 | $167,600 | $366,300 |
| 2022 | $5,532 | $471,600 | $142,500 | $329,100 |
| 2021 | $5,336 | $428,900 | $129,500 | $299,400 |
| 2020 | $5,295 | $429,400 | $129,500 | $299,900 |
| 2019 | $5,080 | $400,300 | $129,500 | $270,800 |
| 2018 | $4,910 | $379,700 | $129,500 | $250,200 |
| 2017 | $4,756 | $360,600 | $123,400 | $237,200 |
| 2016 | $4,595 | $337,600 | $123,800 | $213,800 |
| 2015 | $4,383 | $321,100 | $123,800 | $197,300 |
Source: Public Records
Map
Nearby Homes
- 3 Mondello Square
- 70 Bass Ave
- 11 Wall St Unit R
- 36 Eastern Ave
- 197 E Main St Unit 1
- 26 Marina Dr
- 21 Marble Rd
- 14R Spring St Unit 3
- 23 Mount Vernon St
- 60 Rocky Neck Ave Unit 202
- 73 Rocky Neck Ave Unit 2
- 191 Main St Unit 3
- 191 Main St Unit 2A
- 10 Seaview Rd
- 50 Warner St
- 1 Wonson St
- 113 Pleasant St
- 28 Eastern Point Rd
- 78 Thatcher Rd Unit 6
- 40 Sargent St
Your Personal Tour Guide
Ask me questions while you tour the home.