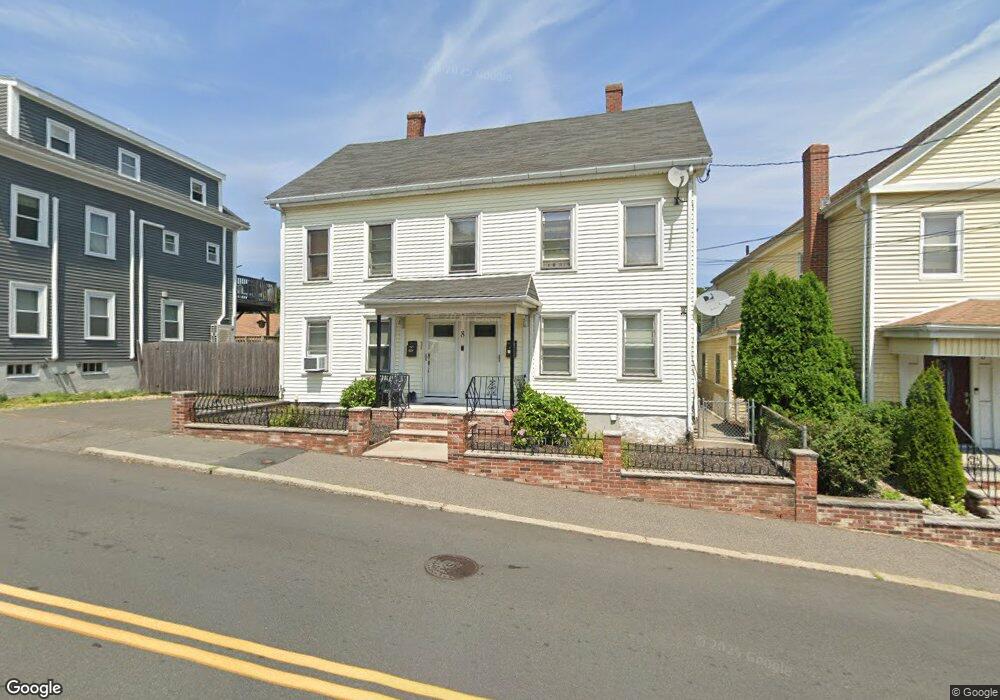
8 Tremont St Salem, MA 01970
Mack Park NeighborhoodEstimated Value: $713,000 - $874,000
8
Beds
2
Baths
2,433
Sq Ft
$328/Sq Ft
Est. Value
About This Home
This home is located at 8 Tremont St, Salem, MA 01970 and is currently estimated at $797,413, approximately $327 per square foot. 8 Tremont St is a home located in Essex County with nearby schools including Bates Elementary School, Witchcraft Heights Elementary School, and Horace Mann Laboratory.
Ownership History
Date
Name
Owned For
Owner Type
Purchase Details
Closed on
Sep 4, 2025
Sold by
Mello Investment Rt and Mello
Bought by
8 Tremont Street Nt and Mello
Current Estimated Value
Purchase Details
Closed on
Mar 2, 2017
Sold by
Mello Daniel G and Mello Maria A
Bought by
Int Mello
Purchase Details
Closed on
Feb 9, 2004
Sold by
Mello Maria A
Bought by
Mello Daniel G
Create a Home Valuation Report for This Property
The Home Valuation Report is an in-depth analysis detailing your home's value as well as a comparison with similar homes in the area
Home Values in the Area
Average Home Value in this Area
Purchase History
| Date | Buyer | Sale Price | Title Company |
|---|---|---|---|
| 8 Tremont Street Nt | -- | -- | |
| 8 Tremont Street Nt | -- | -- | |
| Int Mello | -- | -- | |
| Mello Int | -- | -- | |
| Mello Daniel G | -- | -- | |
| Mello Daniel G | -- | -- |
Source: Public Records
Mortgage History
| Date | Status | Borrower | Loan Amount |
|---|---|---|---|
| Previous Owner | Mello Daniel G | $48,000 | |
| Previous Owner | Mello Daniel G | $163,500 |
Source: Public Records
Tax History
| Year | Tax Paid | Tax Assessment Tax Assessment Total Assessment is a certain percentage of the fair market value that is determined by local assessors to be the total taxable value of land and additions on the property. | Land | Improvement |
|---|---|---|---|---|
| 2025 | $6,638 | $585,400 | $175,000 | $410,400 |
| 2024 | $6,453 | $555,300 | $175,000 | $380,300 |
| 2023 | $6,226 | $497,700 | $160,200 | $337,500 |
| 2022 | $6,408 | $483,600 | $154,200 | $329,400 |
| 2021 | $6,097 | $441,800 | $145,300 | $296,500 |
| 2020 | $5,884 | $407,200 | $130,500 | $276,700 |
| 2019 | $5,746 | $380,500 | $118,700 | $261,800 |
| 2018 | $5,261 | $342,100 | $110,300 | $231,800 |
| 2017 | $5,086 | $320,700 | $103,800 | $216,900 |
| 2016 | $4,718 | $301,100 | $84,200 | $216,900 |
| 2015 | $4,688 | $285,700 | $84,200 | $201,500 |
Source: Public Records
Map
Nearby Homes
- 1 Dunlap St
- 86 Flint St
- 82 Flint St
- 32 Buffum St Unit 2
- 111 Mason St
- 3 S Mason St
- 112 North St
- 145 Federal St Unit 3
- 16 Franklin St Unit 2401
- 16 Franklin St Unit 2403
- 16 Franklin St Unit 1303
- 49 Federal St Unit 2
- 11 Summer St
- 289 Essex St Unit 211
- 289 Essex St Unit 308
- 128 Boston St Unit 4
- 27 Liberty Hill Ave
- 16 Oakland St
- 23 Proctor St
- 17 Orchard St
Your Personal Tour Guide
Ask me questions while you tour the home.