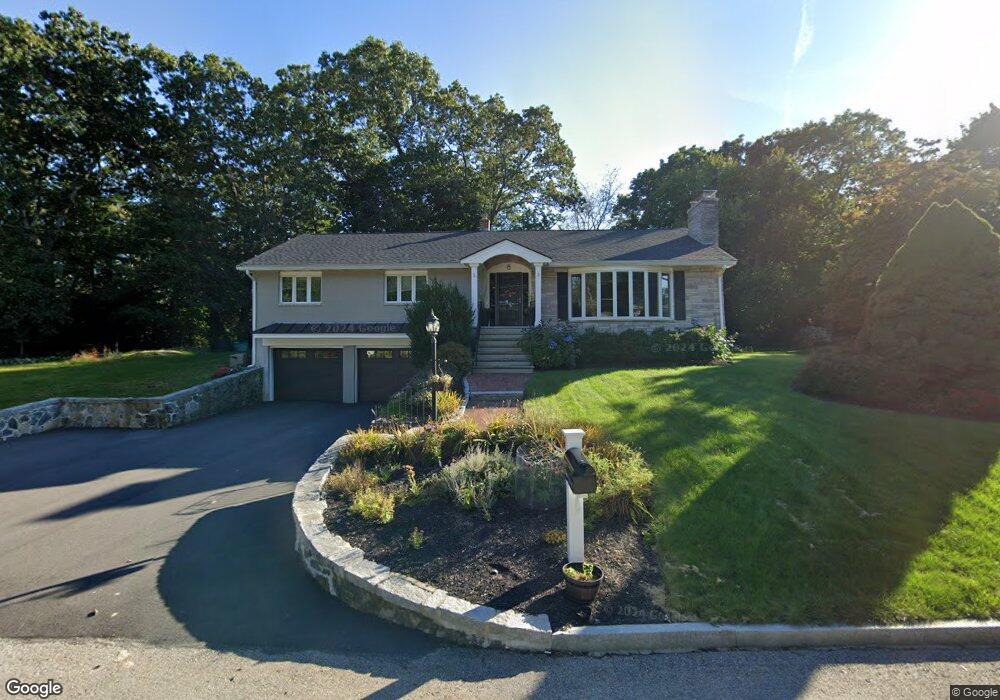
8 Trinity Rd Winchester, MA 01890
West Side NeighborhoodEstimated Value: $1,411,000 - $1,482,000
3
Beds
3
Baths
2,667
Sq Ft
$544/Sq Ft
Est. Value
About This Home
This home is located at 8 Trinity Rd, Winchester, MA 01890 and is currently estimated at $1,451,341, approximately $544 per square foot. 8 Trinity Rd is a home located in Middlesex County with nearby schools including Vinson-Owen Elementary School, McCall Middle School, and Winchester High School.
Ownership History
Date
Name
Owned For
Owner Type
Purchase Details
Closed on
Jul 8, 2005
Sold by
Clemente Bernice M
Bought by
Lucid James M and Lucid Mary B
Current Estimated Value
Home Financials for this Owner
Home Financials are based on the most recent Mortgage that was taken out on this home.
Original Mortgage
$292,000
Interest Rate
5.71%
Mortgage Type
Purchase Money Mortgage
Purchase Details
Closed on
Jul 22, 1999
Sold by
Baldasare Nancy F
Bought by
Clemente Bernice M
Home Financials for this Owner
Home Financials are based on the most recent Mortgage that was taken out on this home.
Original Mortgage
$380,000
Interest Rate
7.49%
Mortgage Type
Purchase Money Mortgage
Create a Home Valuation Report for This Property
The Home Valuation Report is an in-depth analysis detailing your home's value as well as a comparison with similar homes in the area
Home Values in the Area
Average Home Value in this Area
Purchase History
| Date | Buyer | Sale Price | Title Company |
|---|---|---|---|
| Lucid James M | $739,500 | -- | |
| Clemente Bernice M | $400,000 | -- |
Source: Public Records
Mortgage History
| Date | Status | Borrower | Loan Amount |
|---|---|---|---|
| Open | Clemente Bernice M | $259,000 | |
| Closed | Clemente Bernice M | $271,000 | |
| Closed | Lucid James M | $292,000 | |
| Previous Owner | Clemente Bernice M | $100,000 | |
| Previous Owner | Clemente Bernice M | $380,000 |
Source: Public Records
Tax History
| Year | Tax Paid | Tax Assessment Tax Assessment Total Assessment is a certain percentage of the fair market value that is determined by local assessors to be the total taxable value of land and additions on the property. | Land | Improvement |
|---|---|---|---|---|
| 2025 | $143 | $1,291,000 | $899,200 | $391,800 |
| 2024 | $13,869 | $1,224,100 | $834,900 | $389,200 |
| 2023 | $12,699 | $1,076,200 | $706,500 | $369,700 |
| 2022 | $12,725 | $1,017,200 | $674,400 | $342,800 |
| 2021 | $5,647 | $888,700 | $545,900 | $342,800 |
| 2020 | $10,162 | $820,200 | $513,800 | $306,400 |
| 2019 | $113 | $788,100 | $481,700 | $306,400 |
| 2018 | $14,648 | $763,700 | $464,000 | $299,700 |
| 2017 | $7,416 | $709,300 | $413,500 | $295,800 |
| 2016 | $8,050 | $689,200 | $413,500 | $275,700 |
| 2015 | $7,538 | $620,900 | $345,200 | $275,700 |
| 2014 | $7,663 | $605,300 | $345,200 | $260,100 |
Source: Public Records
Map
Nearby Homes
- 9 Trinity Rd
- 39 Apache Trail
- 11 Trinity Rd
- 14 Osceola Path
- 34 Apache Trail
- 15 Osceola Path
- 12 Trinity Rd
- 15 Trinity Rd
- 35 Apache Trail
- 11 Osceola Path
- 30 Apache Trail
- 10 Osceola Path
- 5 Trinity Rd
- 23 Hutchinson Rd
- 14 Trinity Rd
- 31 Apache Trail
- 25 Hutchinson Rd
- 17 Hutchinson Rd
- 26 Apache Trail
- 17 Trinity Rd
Your Personal Tour Guide
Ask me questions while you tour the home.