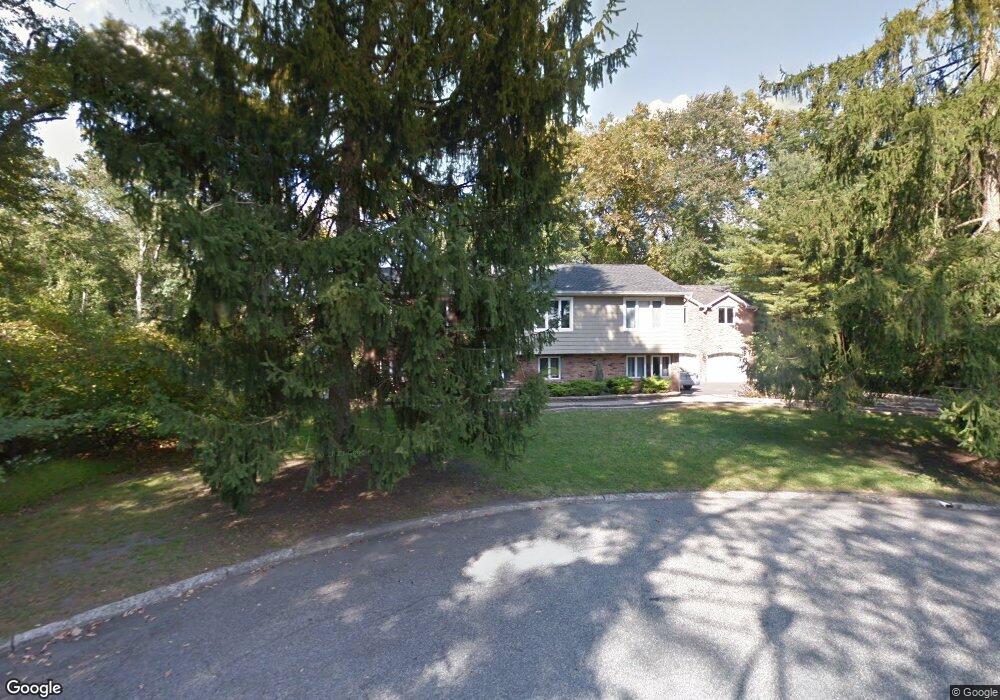
8 Tunis Place Pompton Plains, NJ 07444
Estimated Value: $762,000 - $910,000
--
Bed
--
Bath
2,352
Sq Ft
$362/Sq Ft
Est. Value
About This Home
This home is located at 8 Tunis Place, Pompton Plains, NJ 07444 and is currently estimated at $851,372, approximately $361 per square foot. 8 Tunis Place is a home located in Morris County with nearby schools including Pequannock Twp High School, Netherlands Reformed Christian School, and Holy Spirit School.
Ownership History
Date
Name
Owned For
Owner Type
Purchase Details
Closed on
Jul 7, 2005
Sold by
May Robert
Bought by
May Robert
Current Estimated Value
Home Financials for this Owner
Home Financials are based on the most recent Mortgage that was taken out on this home.
Original Mortgage
$450,000
Outstanding Balance
$224,816
Interest Rate
5%
Mortgage Type
Adjustable Rate Mortgage/ARM
Estimated Equity
$626,556
Purchase Details
Closed on
May 5, 2000
Sold by
Carr Ronald P
Bought by
Carr Joan M
Home Financials for this Owner
Home Financials are based on the most recent Mortgage that was taken out on this home.
Original Mortgage
$310,000
Interest Rate
8.21%
Mortgage Type
Stand Alone First
Purchase Details
Closed on
Jun 10, 1996
Sold by
Adamo Thomas A and Adamo Eileen C Fedor
Bought by
Carr Ronald P and Carr Joan M
Create a Home Valuation Report for This Property
The Home Valuation Report is an in-depth analysis detailing your home's value as well as a comparison with similar homes in the area
Home Values in the Area
Average Home Value in this Area
Purchase History
| Date | Buyer | Sale Price | Title Company |
|---|---|---|---|
| May Robert | -- | -- | |
| Carr Joan M | $310,000 | -- | |
| Carr Ronald P | $245,000 | -- |
Source: Public Records
Mortgage History
| Date | Status | Borrower | Loan Amount |
|---|---|---|---|
| Open | May Robert | $450,000 | |
| Previous Owner | Carr Joan M | $310,000 |
Source: Public Records
Tax History Compared to Growth
Tax History
| Year | Tax Paid | Tax Assessment Tax Assessment Total Assessment is a certain percentage of the fair market value that is determined by local assessors to be the total taxable value of land and additions on the property. | Land | Improvement |
|---|---|---|---|---|
| 2025 | $13,790 | $792,800 | $433,700 | $359,100 |
| 2024 | $13,717 | $755,600 | $411,200 | $344,400 |
| 2023 | $13,717 | $746,300 | $406,700 | $339,600 |
| 2022 | $11,908 | $476,900 | $283,200 | $193,700 |
| 2021 | $11,908 | $476,900 | $283,200 | $193,700 |
| 2020 | $11,756 | $476,900 | $283,200 | $193,700 |
| 2019 | $11,374 | $476,900 | $283,200 | $193,700 |
| 2018 | $10,945 | $476,900 | $283,200 | $193,700 |
| 2017 | $10,592 | $476,900 | $283,200 | $193,700 |
| 2016 | $10,258 | $476,900 | $283,200 | $193,700 |
| 2015 | $10,941 | $511,000 | $283,200 | $227,800 |
| 2014 | $10,680 | $511,000 | $283,200 | $227,800 |
Source: Public Records
Map
Nearby Homes
- 126 Jacksonville Rd
- 10 Copley Ct
- 120 West Pkwy
- 39 Terhune Ave
- 48 Caroline Ave
- 13 van Saun Place
- 18 Sanders Place
- 5 Robert Place
- 108 Boulevard
- 26 Ackerson Ave
- 6 van Saun Place
- 263 Boulevard
- 14 Evelyn Place
- 17 4th St
- 15 4th St
- 27 Wilrue Pkwy
- 107 Chatfield Dr
- 19 Reynolds Rd
- 2 Buckingham Rd
- 520 Newark Pompton Turnpike Unit C316