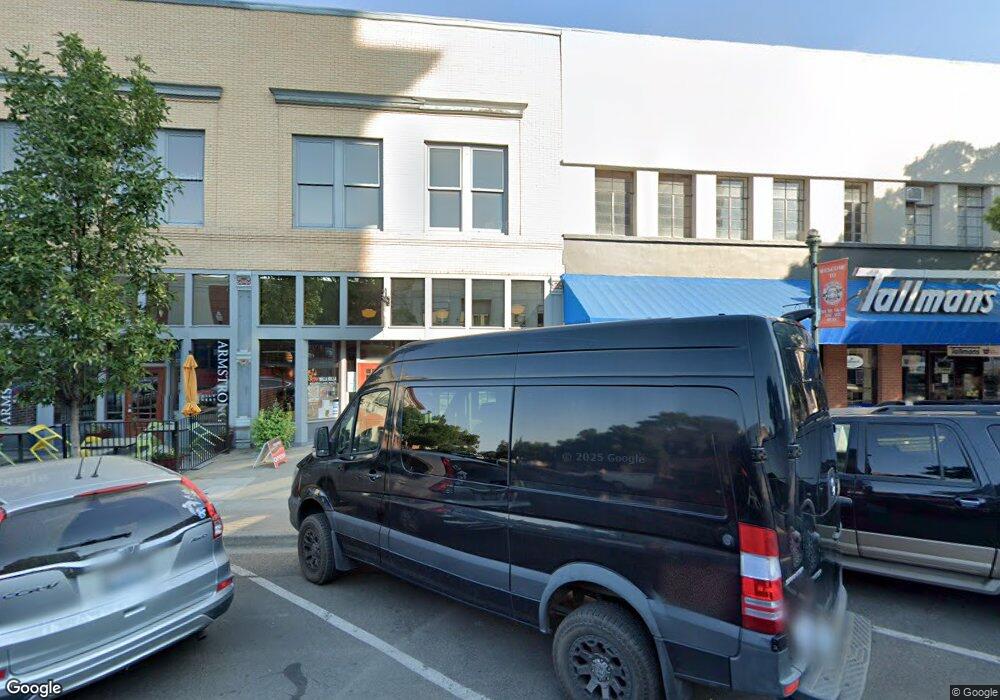
8 W Main St Walla Walla, WA 99362
Estimated Value: $781,926
Studio
--
Bath
4,800
Sq Ft
$163/Sq Ft
Est. Value
About This Home
This home is located at 8 W Main St, Walla Walla, WA 99362 and is currently estimated at $781,926, approximately $162 per square foot. 8 W Main St is a home located in Walla Walla County with nearby schools including Edison Elementary School, Pioneer Middle School, and Willow Public School.
Ownership History
Date
Name
Owned For
Owner Type
Purchase Details
Closed on
Dec 14, 2021
Sold by
Nez Perce Trails Llc
Bought by
Lenihan Investments 2 Llc
Current Estimated Value
Home Financials for this Owner
Home Financials are based on the most recent Mortgage that was taken out on this home.
Original Mortgage
$349,950
Outstanding Balance
$319,779
Interest Rate
3.09%
Mortgage Type
Commercial
Estimated Equity
$462,147
Purchase Details
Closed on
May 17, 2016
Sold by
Poffenroth Dennis R and Nez Perce Trail Llc
Bought by
Johnson James K and Nez Perce Trail Llc
Home Financials for this Owner
Home Financials are based on the most recent Mortgage that was taken out on this home.
Original Mortgage
$305,195
Interest Rate
3.58%
Mortgage Type
Commercial
Create a Home Valuation Report for This Property
The Home Valuation Report is an in-depth analysis detailing your home's value as well as a comparison with similar homes in the area
Purchase History
| Date | Buyer | Sale Price | Title Company |
|---|---|---|---|
| Lenihan Investments 2 Llc | $699,900 | None Available | |
| Johnson James K | $110,811 | None Available | |
| Johnson Linda J | $110,811 | None Available |
Source: Public Records
Mortgage History
| Date | Status | Borrower | Loan Amount |
|---|---|---|---|
| Open | Lenihan Investments 2 Llc | $349,950 | |
| Previous Owner | Johnson Linda J | $305,195 |
Source: Public Records
Tax History
| Year | Tax Paid | Tax Assessment Tax Assessment Total Assessment is a certain percentage of the fair market value that is determined by local assessors to be the total taxable value of land and additions on the property. | Land | Improvement |
|---|---|---|---|---|
| 2025 | $7,129 | $723,100 | $66,000 | $657,100 |
| 2024 | $4,622 | $720,000 | $66,000 | $654,000 |
| 2023 | $4,622 | $521,800 | $59,400 | $462,400 |
| 2022 | $4,423 | $408,200 | $59,400 | $348,800 |
| 2021 | $4,879 | $408,200 | $59,400 | $348,800 |
| 2020 | $4,823 | $408,200 | $59,400 | $348,800 |
| 2019 | $4,412 | $408,200 | $59,400 | $348,800 |
| 2018 | $5,324 | $408,200 | $59,400 | $348,800 |
| 2017 | $4,935 | $403,200 | $59,400 | $343,800 |
| 2016 | $2,796 | $403,200 | $59,400 | $343,800 |
| 2015 | $2,735 | $217,300 | $39,600 | $177,700 |
| 2014 | -- | $217,300 | $39,600 | $177,700 |
| 2013 | -- | $217,300 | $39,600 | $177,700 |
Source: Public Records
Map
Nearby Homes
- 7 N 2nd Ave
- 9 N 2nd Ave
- 11 N 2nd Ave
- 17 N 2nd Ave
- 30 W Main St
- 1 S 2nd Ave
- 7 S 2nd Ave
- 23 E Main St
- 13 E Main St
- 2 E Main St
- 10 E Main St
- 12 E Main St
- 102 W Main St Unit 200
- 14 E Main St Unit 204
- 14 E Main St Unit 211
- 107 N 2nd Ave Unit 501
- 107 N 2nd Ave Unit 401
- 107 N 2nd Ave Unit 301
- 107 N 2nd Ave Unit 126M1
- 107 N 2nd Ave Unit 105B
Your Personal Tour Guide
Ask me questions while you tour the home.