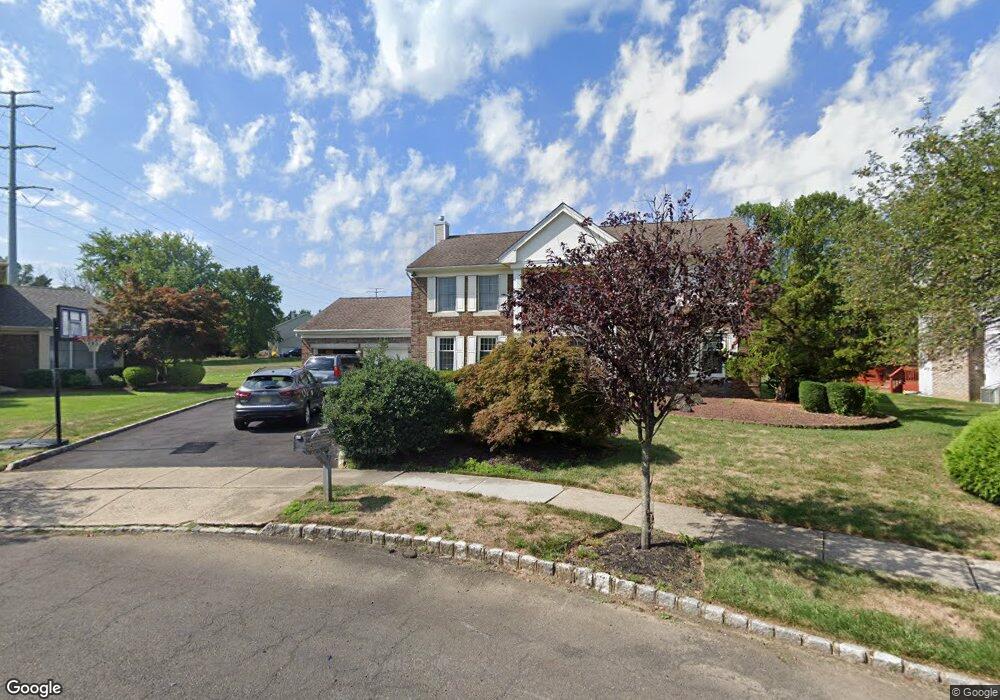
8 Walnut Ct Princeton Junction, NJ 08550
Estimated Value: $1,173,000 - $1,338,051
Studio
--
Bath
3,191
Sq Ft
$391/Sq Ft
Est. Value
About This Home
This home is located at 8 Walnut Ct, Princeton Junction, NJ 08550 and is currently estimated at $1,248,763, approximately $391 per square foot. 8 Walnut Ct is a home located in Mercer County with nearby schools including Village Elementary School, Dutch Neck Elementary School, and Thomas R. Grover Middle School.
Ownership History
Date
Name
Owned For
Owner Type
Purchase Details
Closed on
Mar 30, 2007
Sold by
Petrie Edward
Bought by
Chen Weiling and Zhan Qin
Current Estimated Value
Home Financials for this Owner
Home Financials are based on the most recent Mortgage that was taken out on this home.
Original Mortgage
$562,000
Outstanding Balance
$341,665
Interest Rate
6.25%
Estimated Equity
$907,098
Purchase Details
Closed on
Sep 5, 1990
Sold by
Abitabilo Charles A and Abitabilo Joan T
Bought by
Petrie Edward J and Petrie Joanne C
Create a Home Valuation Report for This Property
The Home Valuation Report is an in-depth analysis detailing your home's value as well as a comparison with similar homes in the area
Home Values in the Area
Average Home Value in this Area
Purchase History
| Date | Buyer | Sale Price | Title Company |
|---|---|---|---|
| Chen Weiling | $702,500 | -- | |
| Petrie Edward J | $347,500 | -- |
Source: Public Records
Mortgage History
| Date | Status | Borrower | Loan Amount |
|---|---|---|---|
| Open | Chen Weiling | $562,000 |
Source: Public Records
Tax History
| Year | Tax Paid | Tax Assessment Tax Assessment Total Assessment is a certain percentage of the fair market value that is determined by local assessors to be the total taxable value of land and additions on the property. | Land | Improvement |
|---|---|---|---|---|
| 2025 | $21,011 | $685,500 | $288,800 | $396,700 |
| 2024 | $20,133 | $685,500 | $288,800 | $396,700 |
| 2023 | $20,133 | $685,500 | $288,800 | $396,700 |
| 2022 | $19,742 | $685,500 | $288,800 | $396,700 |
| 2021 | $19,578 | $685,500 | $288,800 | $396,700 |
| 2020 | $19,221 | $685,500 | $288,800 | $396,700 |
| 2019 | $19,002 | $685,500 | $288,800 | $396,700 |
| 2018 | $18,824 | $685,500 | $288,800 | $396,700 |
| 2017 | $18,433 | $685,500 | $288,800 | $396,700 |
| 2016 | $18,036 | $685,500 | $288,800 | $396,700 |
| 2015 | $17,617 | $685,500 | $288,800 | $396,700 |
| 2014 | $17,412 | $685,500 | $288,800 | $396,700 |
Source: Public Records
Map
Nearby Homes
Your Personal Tour Guide
Ask me questions while you tour the home.