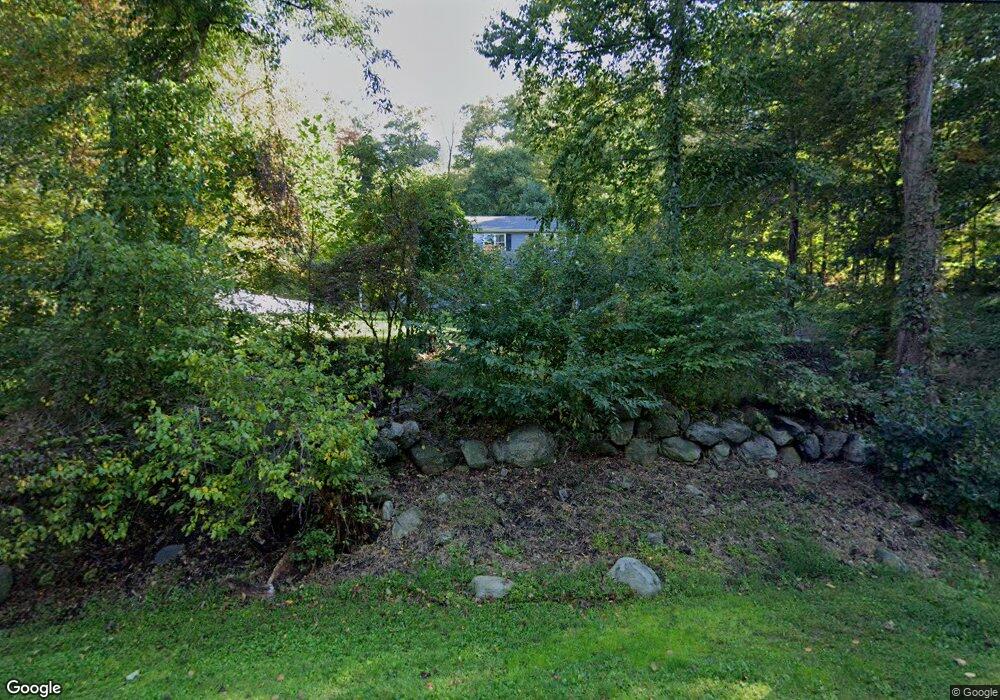
8 Warwick Rd New Fairfield, CT 06812
Estimated Value: $414,000 - $639,000
3
Beds
3
Baths
1,880
Sq Ft
$286/Sq Ft
Est. Value
About This Home
This home is located at 8 Warwick Rd, New Fairfield, CT 06812 and is currently estimated at $537,365, approximately $285 per square foot. 8 Warwick Rd is a home located in Fairfield County with nearby schools including Meeting House Hill School, New Fairfield Middle School, and New Fairfield High School.
Ownership History
Date
Name
Owned For
Owner Type
Purchase Details
Closed on
Nov 15, 2011
Sold by
Glinski Jan and Glinski Iwona
Bought by
Abdulrazak Kamal and Abdulrazak Houn
Current Estimated Value
Home Financials for this Owner
Home Financials are based on the most recent Mortgage that was taken out on this home.
Original Mortgage
$185,200
Outstanding Balance
$126,227
Interest Rate
4.01%
Estimated Equity
$411,138
Purchase Details
Closed on
Aug 5, 2005
Sold by
Koellmer David
Bought by
Glinski Jan and Glinski Iwona
Purchase Details
Closed on
Apr 5, 1988
Sold by
Kordik Steven
Bought by
Glinski Jan
Create a Home Valuation Report for This Property
The Home Valuation Report is an in-depth analysis detailing your home's value as well as a comparison with similar homes in the area
Home Values in the Area
Average Home Value in this Area
Purchase History
| Date | Buyer | Sale Price | Title Company |
|---|---|---|---|
| Abdulrazak Kamal | $231,500 | -- | |
| Glinski Jan | $369,900 | -- | |
| Glinski Jan | $205,000 | -- |
Source: Public Records
Mortgage History
| Date | Status | Borrower | Loan Amount |
|---|---|---|---|
| Closed | Glinski Jan | $55,000 | |
| Open | Glinski Jan | $185,200 |
Source: Public Records
Tax History Compared to Growth
Tax History
| Year | Tax Paid | Tax Assessment Tax Assessment Total Assessment is a certain percentage of the fair market value that is determined by local assessors to be the total taxable value of land and additions on the property. | Land | Improvement |
|---|---|---|---|---|
| 2025 | $8,520 | $323,600 | $115,800 | $207,800 |
| 2024 | $7,494 | $205,200 | $104,700 | $100,500 |
| 2023 | $7,161 | $205,200 | $104,700 | $100,500 |
| 2022 | $6,663 | $205,200 | $104,700 | $100,500 |
| 2021 | $6,462 | $205,200 | $104,700 | $100,500 |
| 2020 | $12,299 | $205,200 | $104,700 | $100,500 |
| 2019 | $6,090 | $197,100 | $104,700 | $92,400 |
| 2018 | $11,274 | $197,100 | $104,700 | $92,400 |
| 2017 | $11,090 | $209,500 | $104,700 | $104,800 |
| 2016 | $6,008 | $209,500 | $104,700 | $104,800 |
| 2015 | $6,008 | $209,500 | $104,700 | $104,800 |
| 2014 | $5,764 | $221,000 | $109,600 | $111,400 |
Source: Public Records
Map
Nearby Homes