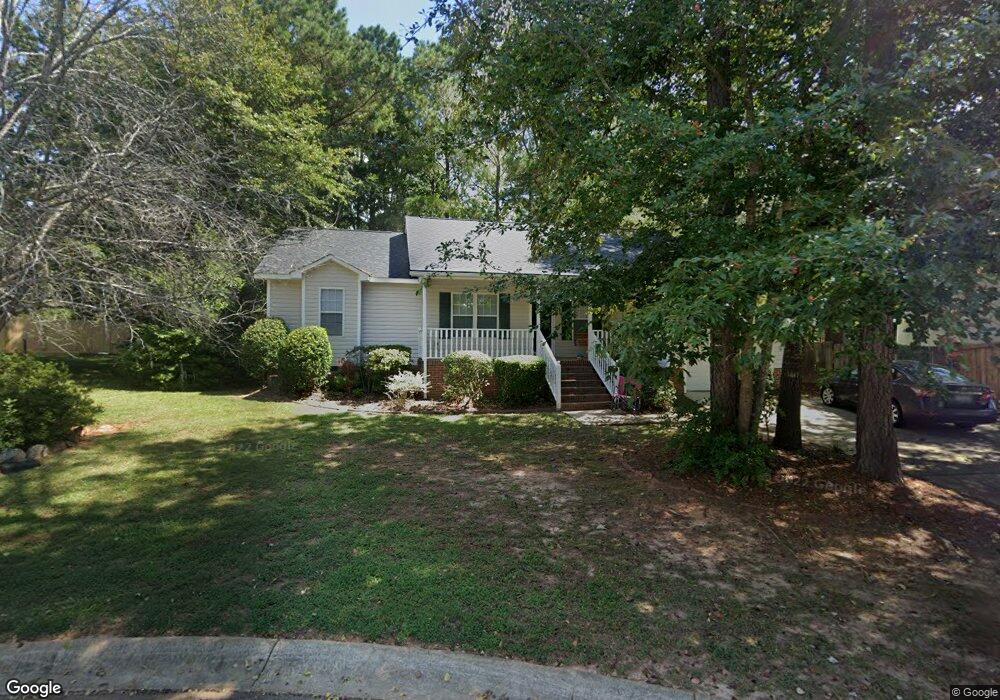
8 Werwich Ct Chapin, SC 29036
Estimated Value: $203,900 - $229,000
3
Beds
2
Baths
1,400
Sq Ft
$152/Sq Ft
Est. Value
About This Home
This home is located at 8 Werwich Ct, Chapin, SC 29036 and is currently estimated at $212,975, approximately $152 per square foot. 8 Werwich Ct is a home located in Lexington County with nearby schools including Chapin Elementary School, Chapin Intermediate, and Chapin High School.
Ownership History
Date
Name
Owned For
Owner Type
Purchase Details
Closed on
Feb 1, 2024
Sold by
Snead Milton Caswell
Bought by
Snead Milton Caswell and Scott Barbara R
Current Estimated Value
Purchase Details
Closed on
Sep 6, 2017
Sold by
Snead Milton Caswell and Snead Milton C
Bought by
Snead Mary Lucinda and Snead Milton Caswell
Purchase Details
Closed on
Nov 25, 2014
Sold by
Snead Arthur Warren and Snead Hampton Leroy
Bought by
Snead Milton Caswell and Snead Mary Lucinda
Purchase Details
Closed on
Nov 4, 2014
Sold by
Snead Arthur Warren and Snead Hampton Leroy
Bought by
Snead Milton Caswell and Snead Mary Lucinda
Purchase Details
Closed on
Oct 20, 2014
Sold by
Snead Milton Caswell
Bought by
Snead Milton Caswell and Snead Mary Lucinda
Purchase Details
Closed on
Sep 13, 1999
Sold by
Harrington Paul W
Bought by
Snead Milton C
Purchase Details
Closed on
Jul 15, 1998
Sold by
P&K Cons Inc
Bought by
Harrington Paul W
Create a Home Valuation Report for This Property
The Home Valuation Report is an in-depth analysis detailing your home's value as well as a comparison with similar homes in the area
Home Values in the Area
Average Home Value in this Area
Purchase History
| Date | Buyer | Sale Price | Title Company |
|---|---|---|---|
| Snead Milton Caswell | -- | None Listed On Document | |
| Snead Mary Lucinda | -- | None Available | |
| Snead Milton Caswell | -- | None Available | |
| Snead Milton Caswell | -- | -- | |
| Snead Milton Caswell | -- | None Available | |
| Snead Milton Caswell | -- | -- | |
| Snead Milton C | $105,500 | -- | |
| Harrington Paul W | $95,684 | -- |
Source: Public Records
Tax History Compared to Growth
Tax History
| Year | Tax Paid | Tax Assessment Tax Assessment Total Assessment is a certain percentage of the fair market value that is determined by local assessors to be the total taxable value of land and additions on the property. | Land | Improvement |
|---|---|---|---|---|
| 2024 | $3,424 | $7,612 | $1,800 | $5,812 |
| 2023 | $3,424 | $7,612 | $1,800 | $5,812 |
| 2020 | $467 | $5,075 | $1,200 | $3,875 |
| 2019 | $382 | $4,553 | $1,000 | $3,553 |
| 2018 | $717 | $4,553 | $1,000 | $3,553 |
| 2017 | $694 | $4,553 | $1,000 | $3,553 |
| 2016 | $710 | $4,553 | $1,000 | $3,553 |
| 2014 | $573 | $4,466 | $782 | $3,684 |
| 2013 | -- | $4,470 | $780 | $3,690 |
Source: Public Records
Map
Nearby Homes
- 428 Firebridge Dr
- 582 Griffon Dr
- 574 Griffon Dr
- 570 Griffon Dr
- 566 Griffon Dr
- 562 Griffon Dr
- 558 Griffon Dr
- 571 Griffon Dr
- 213 Firebridge Ct
- 567 Griffon Dr
- 550 Griffon Dr
- 563 Griffon Dr
- 559 Griffon Dr
- 555 Griffon Dr
- 100 Recluse St
- 551 Griffon Dr
- 615 Griffon Dr
- 547 Griffon Dr
- 538 Griffon Dr
- 517 Griffon Dr
- 6 Werwich Ct
- 10 Werwich Ct
- 34 Garrington Ct
- 33 Garrington Ct
- 4 Werwich Ct
- 12 Werwich Ct
- 29 Garrington Ct
- 30 Garrington Ct
- 5 Werwich Ct
- 13 Werwich Ct
- 9 Werwich Ct
- 2 Werwich Ct
- 165 Firebridge Dr
- 1 Werwich Ct
- 163 Firebridge Dr
- 167 Firebridge Dr
- 161 Firebridge Dr
- 25 Garrington Ct
- 26 Garrington Ct
- 169 Firebridge Dr