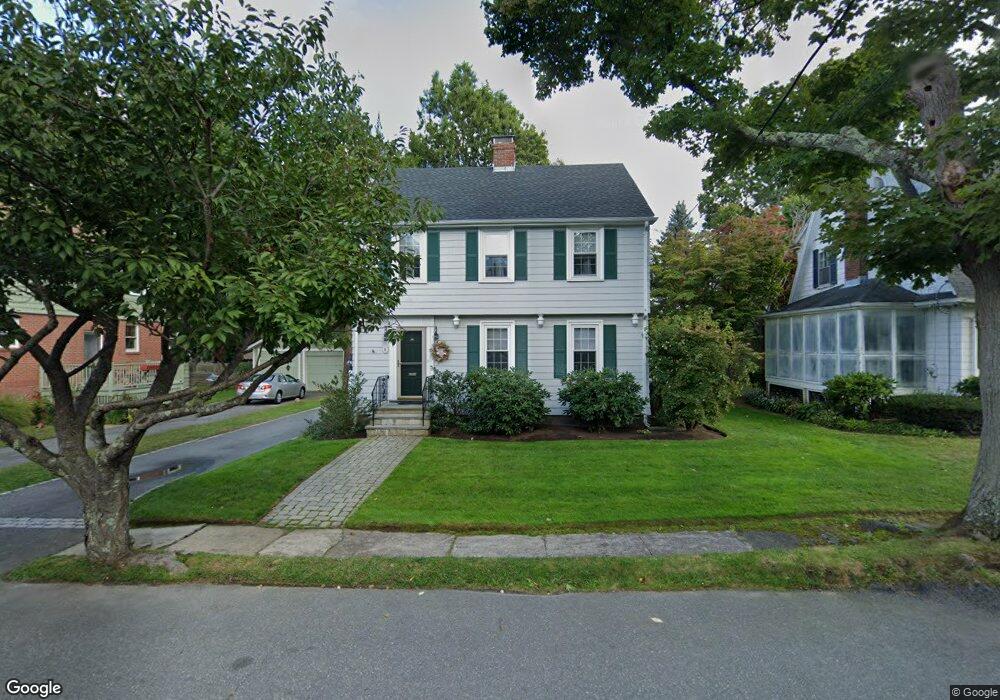
8 Weston Rd Marblehead, MA 01945
Estimated Value: $985,000 - $1,172,000
4
Beds
2
Baths
1,886
Sq Ft
$551/Sq Ft
Est. Value
About This Home
This home is located at 8 Weston Rd, Marblehead, MA 01945 and is currently estimated at $1,038,460, approximately $550 per square foot. 8 Weston Rd is a home located in Essex County with nearby schools including Marblehead High School, Marblehead Community Charter Public School, and Devereux School.
Ownership History
Date
Name
Owned For
Owner Type
Purchase Details
Closed on
Feb 13, 2017
Sold by
Nash Ellen N
Bought by
Ellen N Nash 2017 Ret and Nash
Current Estimated Value
Purchase Details
Closed on
Jul 1, 1976
Bought by
Nash Ellen N
Create a Home Valuation Report for This Property
The Home Valuation Report is an in-depth analysis detailing your home's value as well as a comparison with similar homes in the area
Home Values in the Area
Average Home Value in this Area
Purchase History
| Date | Buyer | Sale Price | Title Company |
|---|---|---|---|
| Ellen N Nash 2017 Ret | -- | -- | |
| Ellen N Nash 2017 Ret | -- | -- | |
| Nash Ellen N | -- | -- |
Source: Public Records
Mortgage History
| Date | Status | Borrower | Loan Amount |
|---|---|---|---|
| Previous Owner | Nash Ellen N | $70,000 | |
| Previous Owner | Nash Ellen N | $135,000 | |
| Previous Owner | Nash Ellen N | $60,000 |
Source: Public Records
Tax History
| Year | Tax Paid | Tax Assessment Tax Assessment Total Assessment is a certain percentage of the fair market value that is determined by local assessors to be the total taxable value of land and additions on the property. | Land | Improvement |
|---|---|---|---|---|
| 2025 | $8,328 | $920,200 | $595,400 | $324,800 |
| 2024 | $8,853 | $988,100 | $674,500 | $313,600 |
| 2023 | $7,243 | $724,300 | $472,800 | $251,500 |
| 2022 | $7,500 | $712,900 | $467,000 | $245,900 |
| 2021 | $6,903 | $662,500 | $420,300 | $242,200 |
| 2020 | $6,745 | $649,200 | $420,300 | $228,900 |
| 2019 | $6,622 | $616,600 | $397,000 | $219,600 |
| 2018 | $6,537 | $593,200 | $373,600 | $219,600 |
| 2017 | $6,146 | $558,200 | $338,600 | $219,600 |
| 2016 | $6,066 | $546,500 | $326,900 | $219,600 |
| 2015 | $5,962 | $538,100 | $303,600 | $234,500 |
| 2014 | $5,555 | $500,900 | $280,200 | $220,700 |
Source: Public Records
Map
Nearby Homes
- 23 Wyman Rd
- 282 Pleasant St
- 7 Cottage St
- 70 Maverick St
- 41 Atlantic Ave Unit 3
- 41 Atlantic Ave Unit 1
- 30 Haley Rd Unit 1
- 290 Washington St Unit A
- 34 Lafayette St
- 6 Mount Vernon St
- 55 Brackett Place Unit B
- 33 W Shore Dr
- 66 Pleasant St Unit 2
- 132 Elm St
- 132 Elm St Unit 132
- 4 Dean Rd
- 7 Lee St Unit 1
- 26 Summer St Unit 1
- 55 Roosevelt Ave
- 45 Pleasant St
Your Personal Tour Guide
Ask me questions while you tour the home.