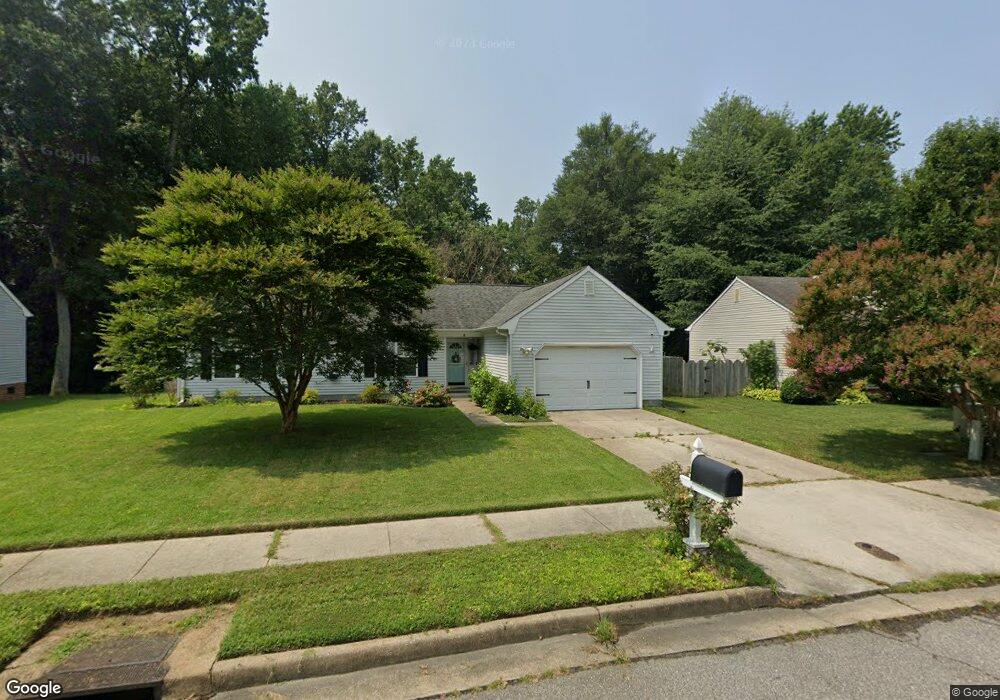
8 Willow Breeze Ct Portsmouth, VA 23703
Churchland NeighborhoodEstimated Value: $318,173 - $347,000
3
Beds
2
Baths
1,481
Sq Ft
$226/Sq Ft
Est. Value
About This Home
This home is located at 8 Willow Breeze Ct, Portsmouth, VA 23703 and is currently estimated at $334,543, approximately $225 per square foot. 8 Willow Breeze Ct is a home located in Portsmouth City with nearby schools including Churchland Primary/Intermediate School, Churchland Middle School, and Churchland High School.
Ownership History
Date
Name
Owned For
Owner Type
Purchase Details
Closed on
Jun 21, 2021
Sold by
Simmons Eric
Bought by
Bauer Jonathan Stuart and Bauer Stacey Renee
Current Estimated Value
Home Financials for this Owner
Home Financials are based on the most recent Mortgage that was taken out on this home.
Original Mortgage
$275,000
Outstanding Balance
$248,435
Interest Rate
2.9%
Mortgage Type
VA
Estimated Equity
$86,108
Purchase Details
Closed on
Jul 3, 2017
Sold by
Meek Eric T and Meek Eileen Paugh
Bought by
Simmons Eric
Home Financials for this Owner
Home Financials are based on the most recent Mortgage that was taken out on this home.
Original Mortgage
$204,300
Interest Rate
3.95%
Mortgage Type
VA
Purchase Details
Closed on
May 27, 2011
Sold by
Cassell Michael T
Bought by
Meek Eric T
Home Financials for this Owner
Home Financials are based on the most recent Mortgage that was taken out on this home.
Original Mortgage
$182,400
Interest Rate
4.85%
Mortgage Type
New Conventional
Create a Home Valuation Report for This Property
The Home Valuation Report is an in-depth analysis detailing your home's value as well as a comparison with similar homes in the area
Home Values in the Area
Average Home Value in this Area
Purchase History
| Date | Buyer | Sale Price | Title Company |
|---|---|---|---|
| Bauer Jonathan Stuart | $275,000 | Navy Federal Title Svcs Llc | |
| Simmons Eric | $200,000 | Attorney | |
| Meek Eric T | $192,000 | -- |
Source: Public Records
Mortgage History
| Date | Status | Borrower | Loan Amount |
|---|---|---|---|
| Open | Bauer Jonathan Stuart | $275,000 | |
| Previous Owner | Simmons Eric | $204,300 | |
| Previous Owner | Meek Eric T | $182,400 |
Source: Public Records
Tax History Compared to Growth
Tax History
| Year | Tax Paid | Tax Assessment Tax Assessment Total Assessment is a certain percentage of the fair market value that is determined by local assessors to be the total taxable value of land and additions on the property. | Land | Improvement |
|---|---|---|---|---|
| 2025 | $3,501 | $272,230 | $72,580 | $199,650 |
| 2024 | $3,501 | $270,710 | $72,580 | $198,130 |
| 2023 | $3,365 | $269,180 | $72,580 | $196,600 |
| 2022 | $3,005 | $231,170 | $60,480 | $170,690 |
| 2021 | $2,722 | $209,400 | $44,800 | $164,600 |
| 2020 | $2,595 | $199,650 | $42,670 | $156,980 |
| 2019 | $2,576 | $198,120 | $42,670 | $155,450 |
| 2018 | $2,536 | $195,070 | $42,670 | $152,400 |
| 2017 | $2,536 | $195,070 | $42,670 | $152,400 |
| 2016 | $2,536 | $195,070 | $42,670 | $152,400 |
| 2015 | $2,536 | $195,070 | $42,670 | $152,400 |
| 2014 | $2,477 | $195,070 | $42,670 | $152,400 |
Source: Public Records
Map
Nearby Homes
- 3433 Willow Breeze Dr
- 5807 Dunkin St
- 3860 Sugar Creek Cir
- 4100 Mayfair Way
- 3866 Augustine Cir
- 3616 Bowden St
- 3660B Towne Point Rd Unit A
- 5806 Fawkes St
- 3818 Peach Orchard Cir
- 3877 Peachtree Ln W
- 6015 Arthur Ave
- 3817 Harvest Ct
- 4200 Quince Rd
- 5911 Dunkirk St
- 17 Shoal Ct
- 3604 Pierce St
- 3791 Towne Point Rd
- 6002 Campbell St
- 8 Compass Ct
- 3913 Stateflower Ct
- 10 Willow Breeze Ct
- 6 Willow Breeze Ct
- 12 Willow Breeze Ct
- 4 Willow Breeze Ct
- 14 Willow Breeze Ct
- 5 Willow Breeze Ct
- 3 Willow Breeze Ct
- 3504 Willow Breeze Dr
- 2 Willow Breeze Ct
- 7 Willow Breeze Ct
- 9 Willow Breeze Ct
- 3508 Willow Breeze Dr
- 11 Willow Breeze Ct
- 16 Willow Breeze Ct
- 3512 Willow Breeze Dr
- 1 Willow Breeze Ct
- 3436 Willow Breeze Dr
- 13 Willow Breeze Ct
- 3606 Gateway Dr
- 18 Willow Breeze Ct