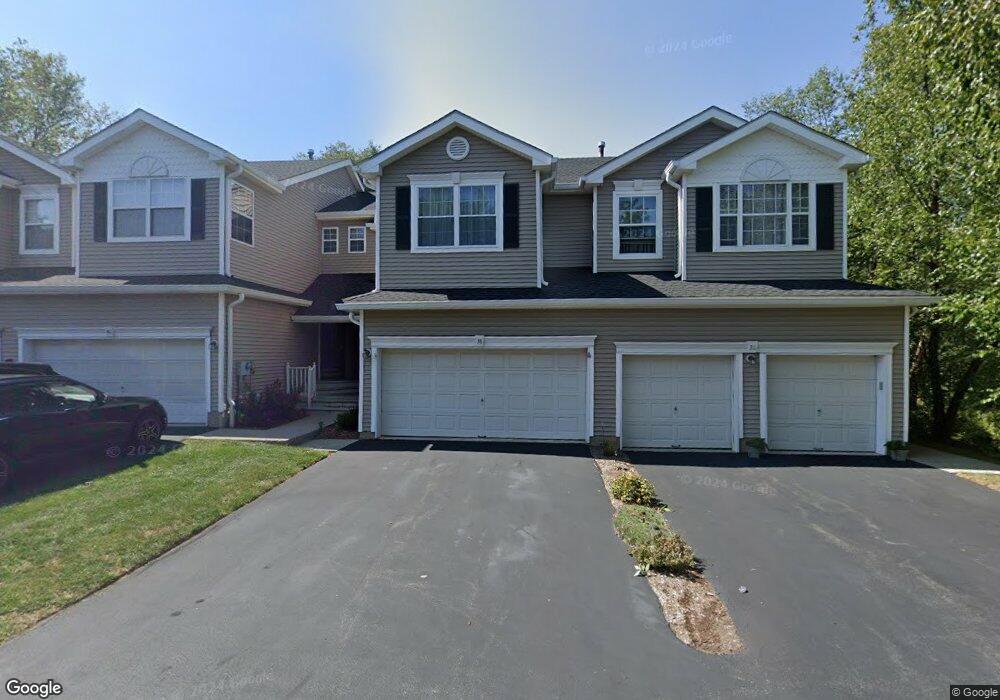
8 Willow Ct Unit 8 Clinton, NJ 08809
Estimated Value: $479,000 - $519,000
Studio
--
Bath
1,765
Sq Ft
$285/Sq Ft
Est. Value
About This Home
This home is located at 8 Willow Ct Unit 8, Clinton, NJ 08809 and is currently estimated at $503,316, approximately $285 per square foot. 8 Willow Ct Unit 8 is a home located in Hunterdon County with nearby schools including Clinton Public School, North Hunterdon High School, and Immaculate Conception School.
Ownership History
Date
Name
Owned For
Owner Type
Purchase Details
Closed on
May 25, 2007
Sold by
Nyitray Peter and Nyitray Iwona
Bought by
Cao Ying and Shao Ying
Current Estimated Value
Home Financials for this Owner
Home Financials are based on the most recent Mortgage that was taken out on this home.
Original Mortgage
$292,000
Outstanding Balance
$177,615
Interest Rate
6.17%
Mortgage Type
Purchase Money Mortgage
Estimated Equity
$325,701
Purchase Details
Closed on
Aug 27, 2002
Sold by
Peterson Shirley J
Bought by
Nyitray Peter and Nyitray Iwona
Home Financials for this Owner
Home Financials are based on the most recent Mortgage that was taken out on this home.
Original Mortgage
$279,000
Interest Rate
6.55%
Purchase Details
Closed on
Jun 3, 1998
Sold by
Alton Place Associates Llc
Bought by
Peterson Shirley J and Ostaficiuk Charlotte H
Home Financials for this Owner
Home Financials are based on the most recent Mortgage that was taken out on this home.
Original Mortgage
$86,000
Interest Rate
7.11%
Create a Home Valuation Report for This Property
The Home Valuation Report is an in-depth analysis detailing your home's value as well as a comparison with similar homes in the area
Home Values in the Area
Average Home Value in this Area
Purchase History
| Date | Buyer | Sale Price | Title Company |
|---|---|---|---|
| Cao Ying | $365,000 | The Talon Group | |
| Nyitray Peter | $310,000 | -- | |
| Peterson Shirley J | $177,900 | -- |
Source: Public Records
Mortgage History
| Date | Status | Borrower | Loan Amount |
|---|---|---|---|
| Open | Cao Ying | $292,000 | |
| Previous Owner | Nyitray Peter | $279,000 | |
| Previous Owner | Peterson Shirley J | $86,000 |
Source: Public Records
Tax History
| Year | Tax Paid | Tax Assessment Tax Assessment Total Assessment is a certain percentage of the fair market value that is determined by local assessors to be the total taxable value of land and additions on the property. | Land | Improvement |
|---|---|---|---|---|
| 2025 | $12,014 | $435,000 | $85,000 | $350,000 |
| 2024 | $11,773 | $399,800 | $85,000 | $314,800 |
Source: Public Records
Map
Nearby Homes
- 4 Pinehurst Cir
- 20 Forsgate Terrace Unit 20
- 4 Jumping Brook Place Unit 4
- 66 Leigh St
- 16 Westchester Terrace
- 7 Westchester Terrace
- 59 La Costa Dr
- 13 Troon Terrace
- 3 Fulper Place
- 3 Augusta Dr
- 68 Westchester Terrace
- 61 Westchester Terrace Unit 5
- 11 Halstead St
- 35 Marudy Dr
- 7 Rachel Ct
- 19 Lexington Rd
- 1 Rossi Dr
- 27 Union Rd
- 54 Meadowview Dr Unit 6F
- 5 Westminster Dr
- 7 Old Orchard Ct
- 9 Old Orchard Ct Unit 9
- 5 Old Orchard Ct Unit 5
- 6 Willow Ct Unit 6
- 11 Old Orchard Ct Unit 11
- 4 Willow Ct Unit 4
- 3 Old Orchard Ct Unit 3
- 2 Willow Ct
- 1 Old Orchard Ct Unit 1
- 5 Alexandra Way
- 1 Alexandra Way
- 7 Willow Ct
- 5 Willow Ct Unit 5
- 3 Alexandra Way Unit 3
- 9 Willow Ct
- 3 Willow Ct Unit 3
- 7 Alexandra Way Unit 7
- 9 Alexandra Way Unit 9
- 1 Willow Ct
- 6 Old Orchard Ct Unit 6
Your Personal Tour Guide
Ask me questions while you tour the home.