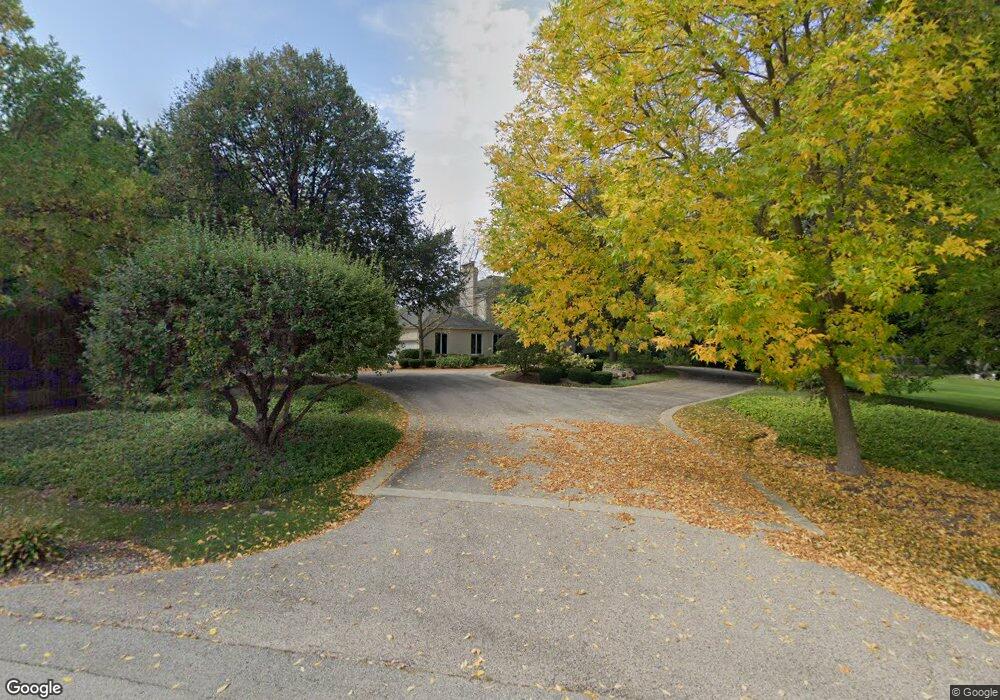
8 Windsor Ct South Barrington, IL 60010
Estimated Value: $1,032,000 - $1,278,000
5
Beds
5
Baths
4,544
Sq Ft
$247/Sq Ft
Est. Value
About This Home
This home is located at 8 Windsor Ct, South Barrington, IL 60010 and is currently estimated at $1,121,717, approximately $246 per square foot. 8 Windsor Ct is a home located in Cook County with nearby schools including Barbara B. Rose Elementary School, Barrington Mdle School- Prairie Cmps, and Barrington High School.
Ownership History
Date
Name
Owned For
Owner Type
Purchase Details
Closed on
Mar 19, 2003
Sold by
Kennedy Real Estate Development Lp
Bought by
T R Klein Development Llc
Current Estimated Value
Home Financials for this Owner
Home Financials are based on the most recent Mortgage that was taken out on this home.
Original Mortgage
$981,468
Outstanding Balance
$424,087
Interest Rate
5.95%
Estimated Equity
$697,630
Purchase Details
Closed on
Jul 23, 2001
Sold by
Lynn Lawrence E and Lynn A
Bought by
Kuznicki Ceaser J and Kuznicki Eva B
Home Financials for this Owner
Home Financials are based on the most recent Mortgage that was taken out on this home.
Original Mortgage
$581,000
Interest Rate
7.23%
Purchase Details
Closed on
Jun 28, 1994
Sold by
Stuker Thomas R and Stuker Joni C
Bought by
Hund Thomas N and Hund Judy L
Home Financials for this Owner
Home Financials are based on the most recent Mortgage that was taken out on this home.
Original Mortgage
$400,000
Interest Rate
7.3%
Purchase Details
Closed on
Jan 14, 1994
Sold by
Bank Of Bellwood
Bought by
Lynn Lawrence E and Lynn A
Home Financials for this Owner
Home Financials are based on the most recent Mortgage that was taken out on this home.
Original Mortgage
$450,000
Interest Rate
7.26%
Create a Home Valuation Report for This Property
The Home Valuation Report is an in-depth analysis detailing your home's value as well as a comparison with similar homes in the area
Home Values in the Area
Average Home Value in this Area
Purchase History
| Date | Buyer | Sale Price | Title Company |
|---|---|---|---|
| T R Klein Development Llc | $355,000 | -- | |
| Kuznicki Ceaser J | $830,000 | -- | |
| Hund Thomas N | $755,000 | Attorneys Title Guaranty Fun | |
| Lynn Lawrence E | $443,333 | -- |
Source: Public Records
Mortgage History
| Date | Status | Borrower | Loan Amount |
|---|---|---|---|
| Open | T R Klein Development Llc | $981,468 | |
| Previous Owner | Kuznicki Ceaser J | $581,000 | |
| Previous Owner | Hund Thomas N | $400,000 | |
| Previous Owner | Lynn Lawrence E | $450,000 |
Source: Public Records
Tax History Compared to Growth
Tax History
| Year | Tax Paid | Tax Assessment Tax Assessment Total Assessment is a certain percentage of the fair market value that is determined by local assessors to be the total taxable value of land and additions on the property. | Land | Improvement |
|---|---|---|---|---|
| 2024 | $16,099 | $77,000 | $26,136 | $50,864 |
| 2023 | $15,609 | $77,000 | $26,136 | $50,864 |
| 2022 | $15,609 | $77,000 | $26,136 | $50,864 |
| 2021 | $14,927 | $65,996 | $19,602 | $46,394 |
| 2020 | $15,247 | $68,889 | $19,602 | $49,287 |
| 2019 | $14,910 | $76,629 | $19,602 | $57,027 |
| 2018 | $16,137 | $77,540 | $17,968 | $59,572 |
| 2017 | $17,181 | $84,447 | $17,968 | $66,479 |
| 2016 | $16,372 | $84,447 | $17,968 | $66,479 |
| 2015 | $15,516 | $74,453 | $16,335 | $58,118 |
| 2014 | $15,439 | $74,453 | $16,335 | $58,118 |
| 2013 | $14,736 | $74,453 | $16,335 | $58,118 |
Source: Public Records
Map
Nearby Homes
- 14 E Penny Rd
- 8 Stone Ridge Dr
- 8 Falcon Lakes Dr
- 303 Algonquin Rd
- 23 Polo Dr
- 34 Abbey Woods Dr
- 40 Polo Dr
- 10 Shoreside Dr
- 3 Shoreside Dr
- 3 Leanda Ln
- 1120 Ashley Ln
- 12 Leanda Ct
- 1115 Ashley Ln
- 45 Willow Bay Dr
- 33 N Liberty Dr
- 1200 Bibury Ln
- 1980 Dogwood Dr
- 16 Forest Ln
- 190 & Rt 59 W Penny Rd
- 39 Forest Ln