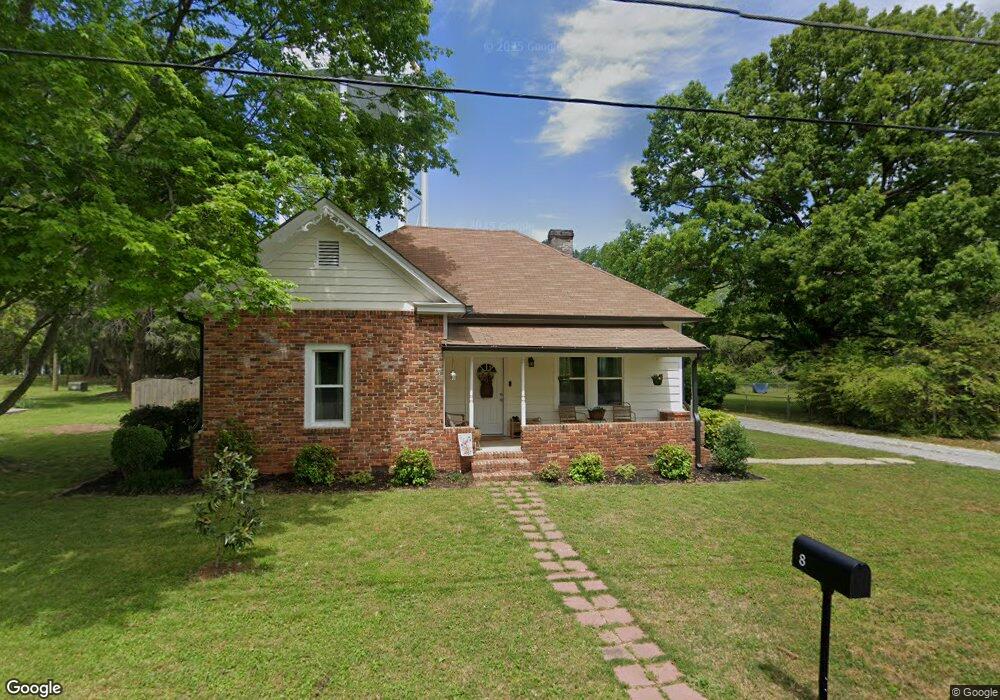
8 Woodlawn Ave Unit 113/3 Hampton, GA 30228
Estimated Value: $215,000 - $249,000
3
Beds
2
Baths
1,543
Sq Ft
$148/Sq Ft
Est. Value
About This Home
This home is located at 8 Woodlawn Ave Unit 113/3, Hampton, GA 30228 and is currently estimated at $228,843, approximately $148 per square foot. 8 Woodlawn Ave Unit 113/3 is a home located in Henry County with nearby schools including Hampton Elementary School, Hampton Middle School, and Hampton High School.
Ownership History
Date
Name
Owned For
Owner Type
Purchase Details
Closed on
Feb 10, 2023
Sold by
Smith Dean
Bought by
Cox Magan and Pier Kasie
Current Estimated Value
Purchase Details
Closed on
Oct 16, 2018
Sold by
Smith Jodi
Bought by
Smith Dean
Home Financials for this Owner
Home Financials are based on the most recent Mortgage that was taken out on this home.
Original Mortgage
$50,875
Interest Rate
4.6%
Mortgage Type
FHA
Purchase Details
Closed on
Dec 21, 2012
Sold by
Stanley Mary Ann Golden
Bought by
Owens Pauletta E
Home Financials for this Owner
Home Financials are based on the most recent Mortgage that was taken out on this home.
Original Mortgage
$21,600
Interest Rate
3.35%
Mortgage Type
New Conventional
Purchase Details
Closed on
Sep 26, 2012
Sold by
Golden Chester D
Bought by
Stanley Mary Ann Golden
Create a Home Valuation Report for This Property
The Home Valuation Report is an in-depth analysis detailing your home's value as well as a comparison with similar homes in the area
Home Values in the Area
Average Home Value in this Area
Purchase History
| Date | Buyer | Sale Price | Title Company |
|---|---|---|---|
| Cox Magan | $75,000 | -- | |
| Smith Dean | -- | -- | |
| Owens Pauletta E | $27,000 | -- | |
| Stanley Mary Ann Golden | -- | -- |
Source: Public Records
Mortgage History
| Date | Status | Borrower | Loan Amount |
|---|---|---|---|
| Previous Owner | Smith Dean | $50,875 | |
| Previous Owner | Owens Pauletta E | $21,600 |
Source: Public Records
Tax History Compared to Growth
Tax History
| Year | Tax Paid | Tax Assessment Tax Assessment Total Assessment is a certain percentage of the fair market value that is determined by local assessors to be the total taxable value of land and additions on the property. | Land | Improvement |
|---|---|---|---|---|
| 2025 | $3,213 | $94,520 | $10,800 | $83,720 |
| 2024 | $3,213 | $93,400 | $10,800 | $82,600 |
| 2023 | $3,302 | $82,760 | $9,000 | $73,760 |
| 2022 | $2,510 | $61,760 | $9,000 | $52,760 |
| 2021 | $1,781 | $49,200 | $9,000 | $40,200 |
| 2020 | $1,667 | $46,040 | $9,000 | $37,040 |
| 2019 | $1,499 | $40,720 | $6,400 | $34,320 |
| 2018 | $18 | $42,160 | $8,000 | $34,160 |
| 2016 | $1,379 | $37,800 | $4,000 | $33,800 |
| 2015 | $1,495 | $39,600 | $4,000 | $35,600 |
| 2014 | $1,138 | $29,920 | $4,000 | $25,920 |
Source: Public Records
Map
Nearby Homes
- 19 Mcdonough St
- 32 Mcdonough St
- 38 Mcdonough St
- 1904 Elm Park Dr
- 21 Elm St
- 2012 Elm Grove Ln
- 14803 Woolsey Rd
- 31 Elm St
- 35 Hampton Oaks Dr
- 2040 Elm Grove Ln
- 2 Cindy Ct
- 325 Peachtree Cir
- 9 Ridge Dr
- 53 Elm St
- 248 Fern Ct
- 218 Nicki Ct
- Ashley 24 Plan at Glenmaye
- Dennis Plan at Glenmaye
- Ashley Plan at Glenmaye
- Hayden Plan at Glenmaye