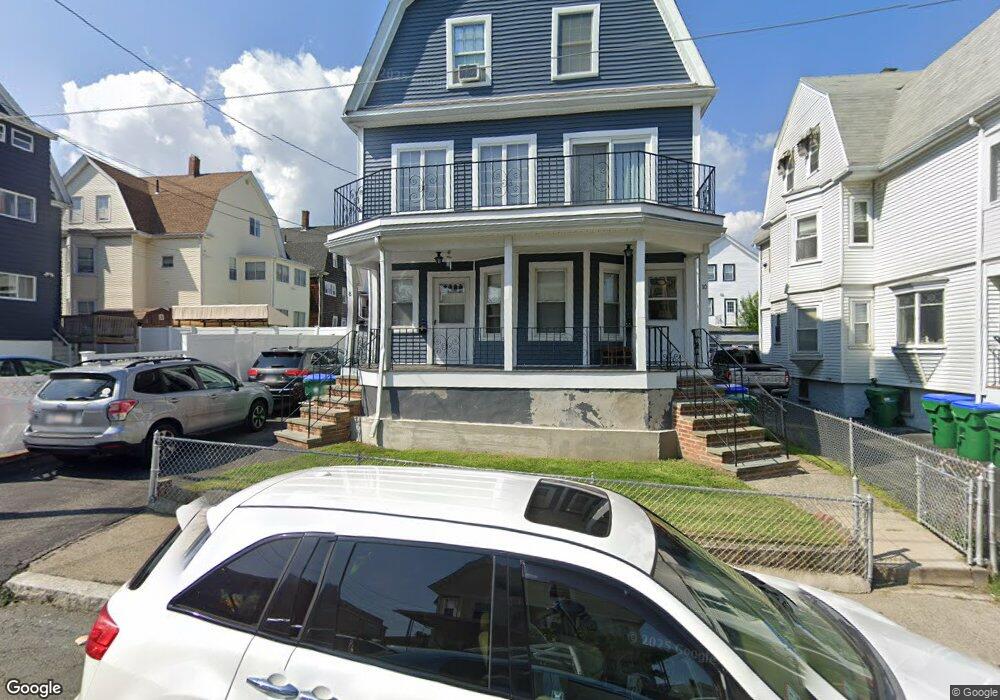
8 Wright Ave Medford, MA 02155
South Medford NeighborhoodEstimated Value: $1,136,000 - $1,285,000
6
Beds
3
Baths
3,781
Sq Ft
$321/Sq Ft
Est. Value
About This Home
This home is located at 8 Wright Ave, Medford, MA 02155 and is currently estimated at $1,212,339, approximately $320 per square foot. 8 Wright Ave is a home located in Middlesex County with nearby schools including Medford High School, St. Clement Elementary School, and St. Joseph School.
Ownership History
Date
Name
Owned For
Owner Type
Purchase Details
Closed on
Nov 29, 2004
Sold by
Catanzano Cosmo and Catanzano Vita
Bought by
Namgyal Chungdak and Namgyal Kalsang
Current Estimated Value
Home Financials for this Owner
Home Financials are based on the most recent Mortgage that was taken out on this home.
Original Mortgage
$468,000
Outstanding Balance
$234,687
Interest Rate
5.75%
Mortgage Type
Purchase Money Mortgage
Estimated Equity
$977,652
Create a Home Valuation Report for This Property
The Home Valuation Report is an in-depth analysis detailing your home's value as well as a comparison with similar homes in the area
Home Values in the Area
Average Home Value in this Area
Purchase History
| Date | Buyer | Sale Price | Title Company |
|---|---|---|---|
| Namgyal Chungdak | $585,000 | -- |
Source: Public Records
Mortgage History
| Date | Status | Borrower | Loan Amount |
|---|---|---|---|
| Open | Namgyal Chungdak | $468,000 |
Source: Public Records
Tax History
| Year | Tax Paid | Tax Assessment Tax Assessment Total Assessment is a certain percentage of the fair market value that is determined by local assessors to be the total taxable value of land and additions on the property. | Land | Improvement |
|---|---|---|---|---|
| 2025 | $10,251 | $1,164,900 | $332,100 | $832,800 |
| 2024 | $9,412 | $1,104,700 | $316,300 | $788,400 |
| 2023 | $9,257 | $1,070,200 | $295,600 | $774,600 |
| 2022 | $9,400 | $1,043,300 | $268,700 | $774,600 |
| 2021 | $8,757 | $930,600 | $255,900 | $674,700 |
| 2020 | $8,645 | $941,700 | $255,900 | $685,800 |
| 2019 | $8,230 | $857,300 | $232,600 | $624,700 |
| 2018 | $7,796 | $761,300 | $211,500 | $549,800 |
| 2017 | $7,279 | $689,300 | $197,700 | $491,600 |
| 2016 | $6,508 | $581,600 | $179,700 | $401,900 |
| 2015 | $6,104 | $521,700 | $171,200 | $350,500 |
Source: Public Records
Map
Nearby Homes
- 297 Main St Unit 3
- 228 Harvard St
- 39 Hancock St Unit 41
- 15 Colby St
- 111 Pearson Rd
- 179 Main St Unit B
- 595 Broadway Unit 302
- 595 Broadway Unit 102
- 595 Broadway Unit 202
- 595 Broadway Unit 101
- 595 Broadway Unit 301
- 7 Bennett St Unit 1
- 7 Smith St Unit 1
- 7 Smith St Unit 2
- 7 Smith St
- 552 Main St
- 288 Cedar St
- 74 Pearson Ave
- 13 Leyden St
- 39 Marston St
Your Personal Tour Guide
Ask me questions while you tour the home.