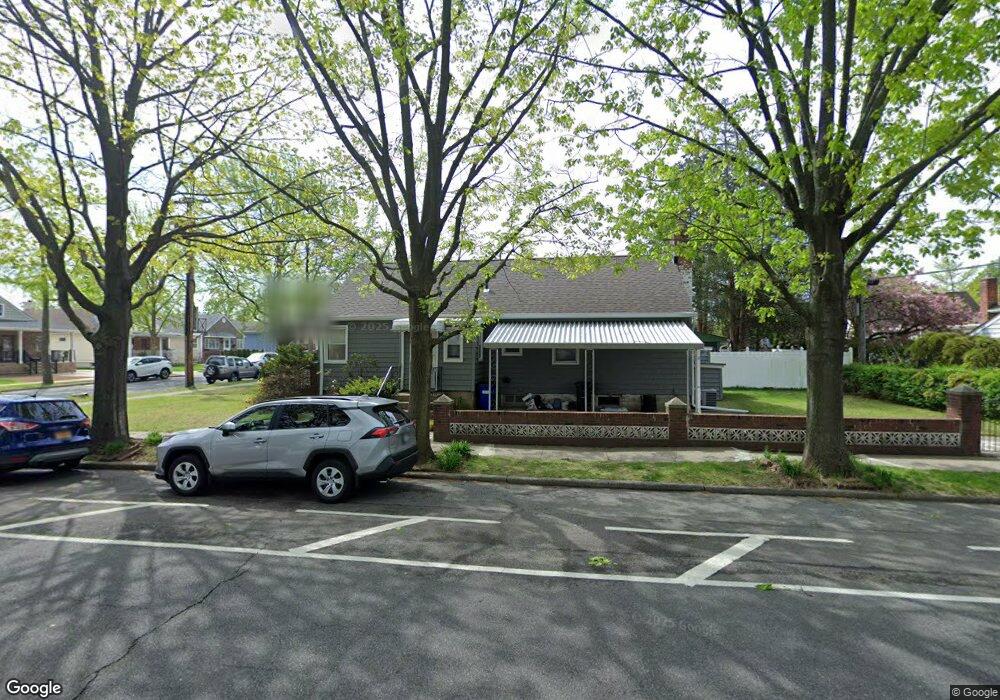
80-04 266th St Glen Oaks, NY 11004
Estimated Value: $796,948 - $894,000
3
Beds
2
Baths
985
Sq Ft
$858/Sq Ft
Est. Value
About This Home
This home is located at 80-04 266th St, Glen Oaks, NY 11004 and is currently estimated at $844,737, approximately $857 per square foot. 80-04 266th St is a home located in Queens County with nearby schools including P.S.115Q James J Ambrose School, Irwin Altman Middle School 172, and Martin Van Buren High School.
Ownership History
Date
Name
Owned For
Owner Type
Purchase Details
Closed on
Mar 30, 2018
Sold by
Friedland Joel R
Bought by
Huang Hsueh-Meei and Kwang-Jen Hsu Mark
Current Estimated Value
Home Financials for this Owner
Home Financials are based on the most recent Mortgage that was taken out on this home.
Original Mortgage
$480,000
Outstanding Balance
$412,792
Interest Rate
4.44%
Mortgage Type
New Conventional
Estimated Equity
$431,945
Purchase Details
Closed on
Apr 17, 2008
Sold by
Friedland Janet S and Friedland Joel R
Bought by
Friedland Joel R
Purchase Details
Closed on
May 7, 2003
Sold by
Friedland Janet S and Friedland Joel R
Bought by
Friedland - Tenants In Common Janet S and Friedland -Tenants In Common Joel R
Create a Home Valuation Report for This Property
The Home Valuation Report is an in-depth analysis detailing your home's value as well as a comparison with similar homes in the area
Home Values in the Area
Average Home Value in this Area
Purchase History
| Date | Buyer | Sale Price | Title Company |
|---|---|---|---|
| Huang Hsueh-Meei | $600,000 | -- | |
| Huang Hsueh-Meei | $600,000 | -- | |
| Friedland Joel R | $270,000 | -- | |
| Friedland Joel R | $270,000 | -- | |
| Friedland - Tenants In Common Janet S | -- | -- | |
| Friedland - Tenants In Common Janet S | -- | -- |
Source: Public Records
Mortgage History
| Date | Status | Borrower | Loan Amount |
|---|---|---|---|
| Open | Huang Hsueh-Meei | $480,000 | |
| Closed | Huang Hsueh-Meei | $480,000 |
Source: Public Records
Tax History Compared to Growth
Tax History
| Year | Tax Paid | Tax Assessment Tax Assessment Total Assessment is a certain percentage of the fair market value that is determined by local assessors to be the total taxable value of land and additions on the property. | Land | Improvement |
|---|---|---|---|---|
| 2025 | $7,383 | $38,448 | $13,297 | $25,151 |
| 2024 | $7,395 | $38,160 | $12,400 | $25,760 |
| 2023 | $6,949 | $36,000 | $12,335 | $23,665 |
| 2022 | $6,493 | $41,520 | $15,480 | $26,040 |
| 2021 | $6,447 | $40,440 | $15,480 | $24,960 |
| 2020 | $6,486 | $38,520 | $15,480 | $23,040 |
| 2019 | $6,359 | $38,280 | $15,480 | $22,800 |
| 2018 | $5,818 | $30,000 | $13,921 | $16,079 |
| 2017 | $5,470 | $28,302 | $13,674 | $14,628 |
| 2016 | $5,028 | $28,302 | $13,674 | $14,628 |
| 2015 | $3,303 | $28,008 | $15,340 | $12,668 |
| 2014 | $3,303 | $27,856 | $17,083 | $10,773 |
Source: Public Records
Map
Nearby Homes
- 8019 266th St
- 80-43 263rd St
- 78-07 264th St
- 80-59 268th St
- 81-25 265th St
- 80-18 261st St
- 7927 270th St
- 81-46 266th St
- 78-30 270th St
- 81-40 268th St
- 8049 260th St
- 81-50 Langdale St Unit 259a
- 81-56 264th St
- 8168 Langdale St Unit 263A
- 81-09 Langdale St Unit 217A
- 81-49 268th St Unit 290B
- 80-37 259th St
- 26612 82nd Ave
- 268-03 82nd Ave Unit 286A
- 7653 268th St