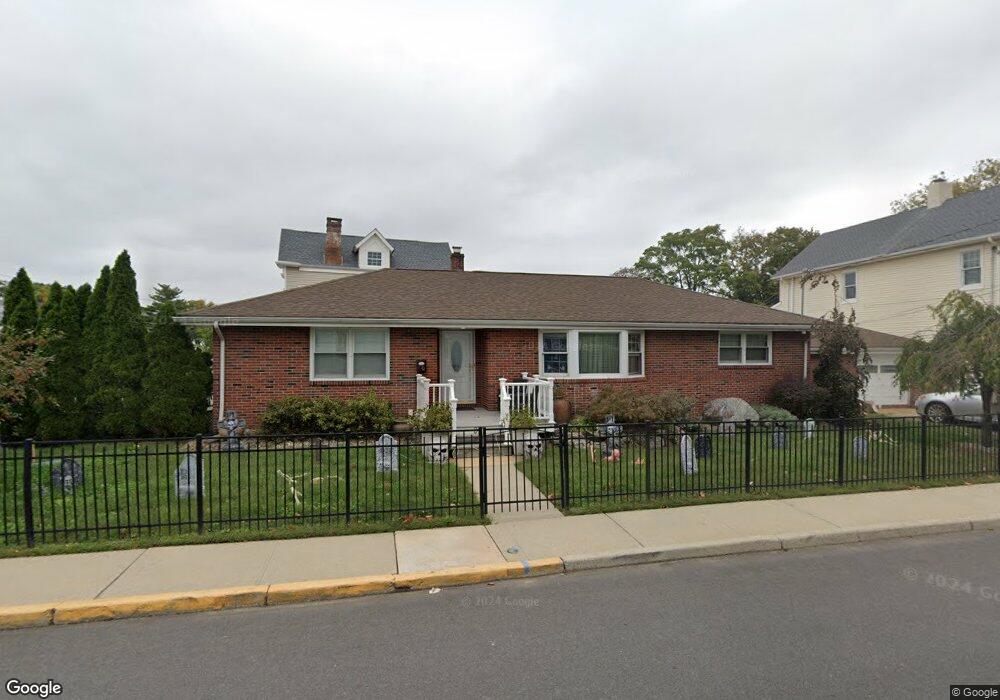
80 3rd St Keyport, NJ 07735
Estimated Value: $512,000 - $594,907
3
Beds
2
Baths
1,441
Sq Ft
$386/Sq Ft
Est. Value
About This Home
This home is located at 80 3rd St, Keyport, NJ 07735 and is currently estimated at $556,477, approximately $386 per square foot. 80 3rd St is a home located in Monmouth County with nearby schools including Keyport Central School, Keyport High School, and Icob Academy.
Ownership History
Date
Name
Owned For
Owner Type
Purchase Details
Closed on
Jun 28, 2006
Sold by
Hingher Kyle R
Bought by
Bednarz Kenneth and Gatti Rosa
Current Estimated Value
Home Financials for this Owner
Home Financials are based on the most recent Mortgage that was taken out on this home.
Original Mortgage
$260,000
Outstanding Balance
$153,929
Interest Rate
6.6%
Mortgage Type
New Conventional
Estimated Equity
$402,548
Purchase Details
Closed on
Apr 14, 2004
Sold by
Vanheusen Adam
Bought by
Hingher Kyle and Hignher Melissa
Home Financials for this Owner
Home Financials are based on the most recent Mortgage that was taken out on this home.
Original Mortgage
$223,250
Interest Rate
5.39%
Purchase Details
Closed on
Sep 23, 1997
Sold by
Dawidowicz John
Bought by
Vanheusen Adam and Van Heusen Debra
Home Financials for this Owner
Home Financials are based on the most recent Mortgage that was taken out on this home.
Original Mortgage
$137,000
Interest Rate
7.52%
Mortgage Type
VA
Purchase Details
Closed on
Oct 17, 1996
Sold by
Citicorp North
Bought by
Dawidowicz John and Dawidowicz Carol
Create a Home Valuation Report for This Property
The Home Valuation Report is an in-depth analysis detailing your home's value as well as a comparison with similar homes in the area
Home Values in the Area
Average Home Value in this Area
Purchase History
| Date | Buyer | Sale Price | Title Company |
|---|---|---|---|
| Bednarz Kenneth | $310,000 | -- | |
| Hingher Kyle | $235,000 | -- | |
| Vanheusen Adam | $134,000 | -- | |
| Dawidowicz John | $65,000 | -- |
Source: Public Records
Mortgage History
| Date | Status | Borrower | Loan Amount |
|---|---|---|---|
| Open | Bednarz Kenneth | $260,000 | |
| Previous Owner | Hingher Kyle | $223,250 | |
| Previous Owner | Vanheusen Adam | $137,000 |
Source: Public Records
Tax History Compared to Growth
Tax History
| Year | Tax Paid | Tax Assessment Tax Assessment Total Assessment is a certain percentage of the fair market value that is determined by local assessors to be the total taxable value of land and additions on the property. | Land | Improvement |
|---|---|---|---|---|
| 2025 | $10,932 | $576,100 | $212,000 | $364,100 |
| 2024 | $11,364 | $528,100 | $182,000 | $346,100 |
Source: Public Records
Map
Nearby Homes
- 87 Church St
- 55 E Front St
- 226 Osborn St
- 37 Myrtle Ave
- 72 Manchester Ave
- 162 2nd St
- 74 Manchester Ave
- 231 Atlantic St Unit 23
- 231 Atlantic St Unit 83
- 9 Monmouth Place
- 2108 Florence Ave
- 95 Broadway
- 121-123 Stone Rd
- 233 Broadway
- 308 Stone Rd
- 253 Broadway
- 8 Pine Creek Village
- 104 Therese Ave
- 975 S Concourse
- 910 Malden Dr