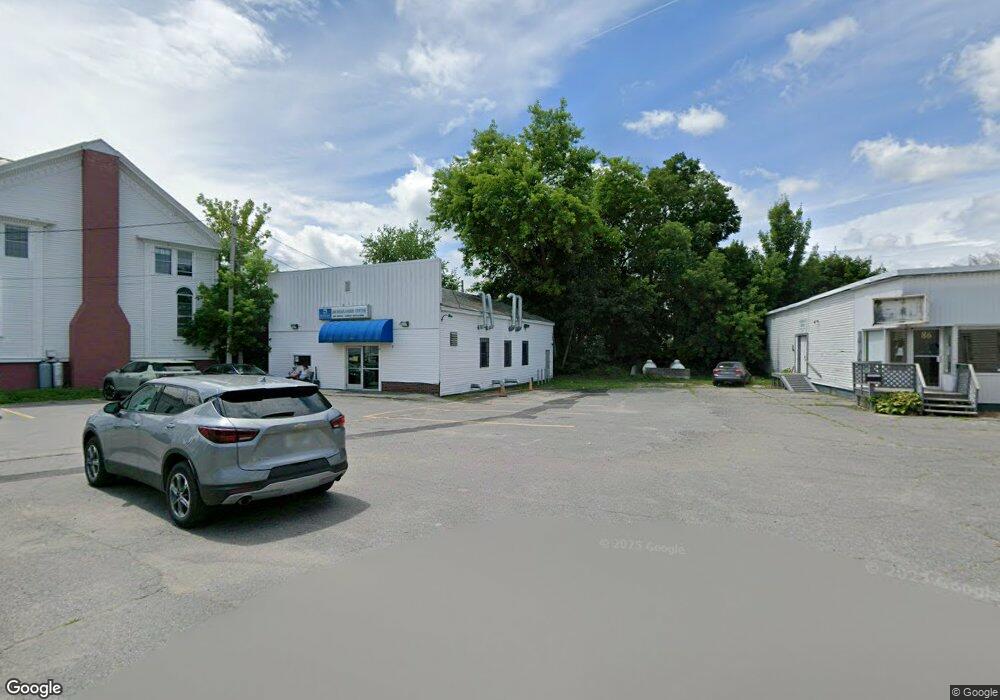
80-88 Elm St Waterville, ME 04901
Estimated Value: $1,395,930
--
Bed
--
Bath
--
Sq Ft
0.89
Acres
About This Home
This home is located at 80-88 Elm St, Waterville, ME 04901 and is currently estimated at $1,395,930. 80-88 Elm St is a home located in Kennebec County with nearby schools including George J. Mitchell School, Albert S. Hall School, and Waterville Junior High School.
Ownership History
Date
Name
Owned For
Owner Type
Purchase Details
Closed on
Jan 7, 2025
Sold by
Underwood Prop Mgmt Llc
Bought by
Elm Street Rentals Llc
Current Estimated Value
Home Financials for this Owner
Home Financials are based on the most recent Mortgage that was taken out on this home.
Original Mortgage
$1,200,000
Outstanding Balance
$1,189,524
Interest Rate
6.81%
Mortgage Type
Commercial
Estimated Equity
$206,406
Purchase Details
Closed on
Jul 7, 2009
Sold by
Hutchinson Realty Ent Llc
Bought by
Underwood Prop Mgmt Llc
Home Financials for this Owner
Home Financials are based on the most recent Mortgage that was taken out on this home.
Original Mortgage
$442,500
Interest Rate
4.86%
Mortgage Type
Commercial
Purchase Details
Closed on
Dec 5, 2005
Sold by
Elm Street Apartments Llc
Bought by
Hutchinson Realty Ent Llc
Create a Home Valuation Report for This Property
The Home Valuation Report is an in-depth analysis detailing your home's value as well as a comparison with similar homes in the area
Home Values in the Area
Average Home Value in this Area
Purchase History
| Date | Buyer | Sale Price | Title Company |
|---|---|---|---|
| Elm Street Rentals Llc | $1,300,000 | None Available | |
| Underwood Prop Mgmt Llc | -- | -- | |
| Underwood Prop Mgmt Llc | -- | -- | |
| Underwood Prop Mgmt Llc | -- | -- | |
| Hutchinson Realty Ent Llc | $510,000 | -- | |
| Hutchinson Realty Ent Llc | $510,000 | -- |
Source: Public Records
Mortgage History
| Date | Status | Borrower | Loan Amount |
|---|---|---|---|
| Open | Elm Street Rentals Llc | $1,200,000 | |
| Previous Owner | Underwood Prop Mgmt Llc | $442,500 |
Source: Public Records
Tax History Compared to Growth
Tax History
| Year | Tax Paid | Tax Assessment Tax Assessment Total Assessment is a certain percentage of the fair market value that is determined by local assessors to be the total taxable value of land and additions on the property. | Land | Improvement |
|---|---|---|---|---|
| 2025 | $14,321 | $842,400 | $74,900 | $767,500 |
| 2024 | $9,068 | $453,400 | $32,300 | $421,100 |
| 2023 | $9,023 | $453,400 | $32,300 | $421,100 |
| 2022 | $11,480 | $444,100 | $32,300 | $411,800 |
| 2021 | $11,325 | $444,100 | $32,300 | $411,800 |
| 2020 | $11,440 | $444,100 | $32,300 | $411,800 |
| 2019 | $11,440 | $444,100 | $32,300 | $411,800 |
| 2018 | $11,222 | $444,100 | $32,300 | $411,800 |
| 2017 | $10,361 | $444,100 | $32,300 | $411,800 |
| 2016 | $10,125 | $444,100 | $32,300 | $411,800 |
| 2015 | $10,503 | $377,800 | $34,100 | $343,700 |
| 2014 | $10,352 | $377,800 | $34,100 | $343,700 |
| 2013 | $10,352 | $377,800 | $34,100 | $343,700 |
Source: Public Records
Map
Nearby Homes