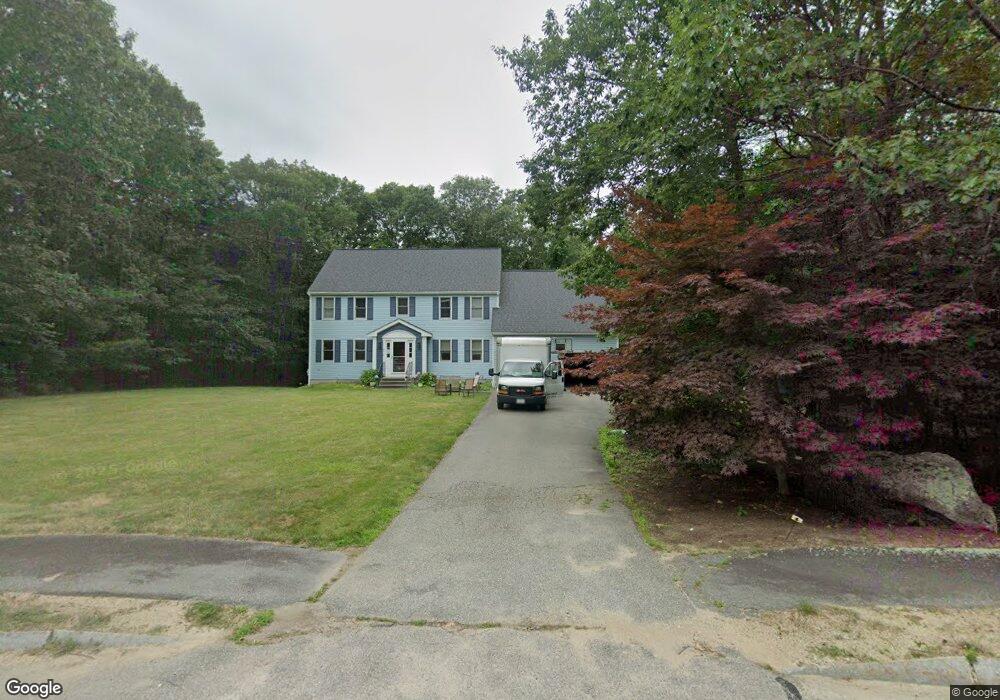
80 Azalea Rd Sharon, MA 02067
Estimated Value: $1,101,000 - $1,273,000
4
Beds
4
Baths
2,557
Sq Ft
$453/Sq Ft
Est. Value
About This Home
This home is located at 80 Azalea Rd, Sharon, MA 02067 and is currently estimated at $1,157,369, approximately $452 per square foot. 80 Azalea Rd is a home located in Norfolk County with nearby schools including East Elementary School, Sharon Middle School, and Sharon High School.
Ownership History
Date
Name
Owned For
Owner Type
Purchase Details
Closed on
Aug 15, 2012
Sold by
Fine Kenneth A and Fine Phyllis
Bought by
Kumar Yogendra and Gupta Ami
Current Estimated Value
Home Financials for this Owner
Home Financials are based on the most recent Mortgage that was taken out on this home.
Original Mortgage
$484,000
Outstanding Balance
$319,612
Interest Rate
3%
Mortgage Type
Adjustable Rate Mortgage/ARM
Estimated Equity
$837,757
Purchase Details
Closed on
Sep 1, 1999
Sold by
Mandelblatt David L and Mandelblatt Jill Mn
Bought by
Fine Kenneth A
Home Financials for this Owner
Home Financials are based on the most recent Mortgage that was taken out on this home.
Original Mortgage
$391,500
Interest Rate
7.5%
Mortgage Type
Purchase Money Mortgage
Purchase Details
Closed on
Aug 15, 1996
Sold by
Fulco Inc
Bought by
Madelblatt David J
Create a Home Valuation Report for This Property
The Home Valuation Report is an in-depth analysis detailing your home's value as well as a comparison with similar homes in the area
Home Values in the Area
Average Home Value in this Area
Purchase History
| Date | Buyer | Sale Price | Title Company |
|---|---|---|---|
| Kumar Yogendra | $605,000 | -- | |
| Fine Kenneth A | $435,000 | -- | |
| Madelblatt David J | $335,739 | -- |
Source: Public Records
Mortgage History
| Date | Status | Borrower | Loan Amount |
|---|---|---|---|
| Open | Kumar Yogendra | $484,000 | |
| Closed | Kumar Yogendra | $59,895 | |
| Previous Owner | Madelblatt David J | $391,500 | |
| Previous Owner | Madelblatt David J | $225,000 | |
| Previous Owner | Madelblatt David J | $225,000 |
Source: Public Records
Tax History
| Year | Tax Paid | Tax Assessment Tax Assessment Total Assessment is a certain percentage of the fair market value that is determined by local assessors to be the total taxable value of land and additions on the property. | Land | Improvement |
|---|---|---|---|---|
| 2025 | $17,606 | $1,007,200 | $512,200 | $495,000 |
| 2024 | $16,893 | $960,900 | $470,000 | $490,900 |
| 2023 | $16,121 | $867,200 | $439,200 | $428,000 |
| 2022 | $15,302 | $774,800 | $366,100 | $408,700 |
| 2021 | $15,179 | $743,000 | $345,900 | $397,100 |
| 2020 | $14,413 | $758,600 | $361,500 | $397,100 |
| 2019 | $13,653 | $703,400 | $306,300 | $397,100 |
| 2018 | $13,505 | $697,200 | $300,100 | $397,100 |
| 2017 | $13,300 | $677,900 | $280,800 | $397,100 |
| 2016 | $13,494 | $671,000 | $308,600 | $362,400 |
| 2015 | $13,290 | $654,700 | $308,900 | $345,800 |
| 2014 | $12,342 | $600,600 | $281,500 | $319,100 |
Source: Public Records
Map
Nearby Homes
Your Personal Tour Guide
Ask me questions while you tour the home.