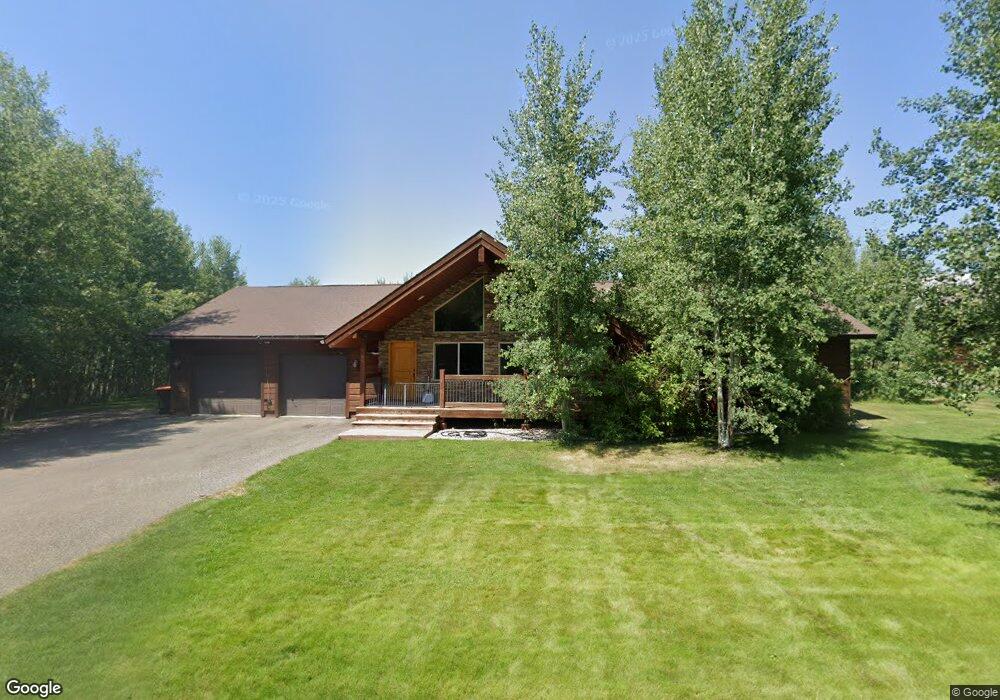
80 Baldy Mtn Dr Victor, ID 83455
Estimated Value: $922,000 - $1,154,000
4
Beds
2
Baths
3,656
Sq Ft
$271/Sq Ft
Est. Value
About This Home
This home is located at 80 Baldy Mtn Dr, Victor, ID 83455 and is currently estimated at $990,295, approximately $270 per square foot. 80 Baldy Mtn Dr is a home with nearby schools including Victor Elementary School and Teton High School.
Ownership History
Date
Name
Owned For
Owner Type
Purchase Details
Closed on
Sep 17, 2018
Sold by
Martinez Joseph Nash
Bought by
Warren Josephine Allison
Current Estimated Value
Purchase Details
Closed on
Mar 9, 2014
Sold by
Martinez Joseph Nash and Martinez Josephine Allison
Bought by
Martinez Joseph Nash and Warren Joephine Allison
Home Financials for this Owner
Home Financials are based on the most recent Mortgage that was taken out on this home.
Original Mortgage
$228,800
Interest Rate
4.18%
Mortgage Type
New Conventional
Purchase Details
Closed on
Jul 10, 2006
Sold by
Kunz Val D and Kunz Susan G
Bought by
Martinez Joseph Nash and Warren Josephine Allison
Home Financials for this Owner
Home Financials are based on the most recent Mortgage that was taken out on this home.
Original Mortgage
$254,400
Interest Rate
6.63%
Mortgage Type
New Conventional
Create a Home Valuation Report for This Property
The Home Valuation Report is an in-depth analysis detailing your home's value as well as a comparison with similar homes in the area
Home Values in the Area
Average Home Value in this Area
Purchase History
| Date | Buyer | Sale Price | Title Company |
|---|---|---|---|
| Warren Josephine Allison | -- | Alliance Title Driggs Office | |
| Martinez Joseph Nash | -- | None Available | |
| Martinez Joseph Nash | -- | -- |
Source: Public Records
Mortgage History
| Date | Status | Borrower | Loan Amount |
|---|---|---|---|
| Previous Owner | Martinez Joseph Nash | $228,800 | |
| Previous Owner | Martinez Joseph Nash | $254,400 |
Source: Public Records
Tax History Compared to Growth
Tax History
| Year | Tax Paid | Tax Assessment Tax Assessment Total Assessment is a certain percentage of the fair market value that is determined by local assessors to be the total taxable value of land and additions on the property. | Land | Improvement |
|---|---|---|---|---|
| 2025 | $2,885 | $852,141 | $125,000 | $727,141 |
| 2024 | $2,885 | $852,141 | $125,000 | $727,141 |
| 2023 | $2,885 | $842,141 | $115,000 | $727,141 |
| 2022 | $2,933 | $675,438 | $100,000 | $575,438 |
| 2021 | $2,899 | $463,245 | $60,000 | $403,245 |
| 2020 | $2,865 | $373,148 | $42,000 | $331,148 |
| 2019 | $2,795 | $371,148 | $40,000 | $331,148 |
| 2018 | $2,689 | $340,367 | $36,000 | $304,367 |
| 2017 | $2,458 | $334,367 | $30,000 | $304,367 |
| 2016 | $2,336 | $299,659 | $28,000 | $271,659 |
| 2015 | $2,206 | $258,784 | $23,000 | $235,784 |
| 2011 | -- | $277,539 | $35,000 | $242,539 |
Source: Public Records
Map
Nearby Homes
- 7898 House Top Ln
- 138 Larkspur Ave Unit 402
- 138 Larkspur Ave Unit 401
- 140 Larkspur Ave Unit 603
- 7579 Mountain Laurel Dr
- 7580 Mountain Laurel Dr Unit A-8
- 172 Brome Dr
- 170 Homestead Rd Unit 412
- 342 Larkspur Ave
- 200 Homestead Rd Unit 305
- 106 Antelope Ln
- 220 Homestead Rd Unit 203
- 220 Homestead Rd Unit 214
- 90 Alpine Trail Unit 31
- 850 S 17 W
- 80 Eva Ln Unit 14
- 68 Alpine Trail Unit 38
- 228 Lakewood Rd
- TBD S Baseline
- 198 Cattail Rd
- 106 Baldy Mountain Dr
- 106 Baldy Mtn Dr
- 58 Baldy Mountain Dr
- 58 Baldy Mtn Dr
- 7796 House Top Ln
- 8 Big Bear
- 126 Baldy Mountain Dr
- 7823 Mountain Shadows Way
- 126 Baldy Mtn Dr
- 117 Baldy Mtn Dr
- 7798 Mountain Shadow Way
- 7823 Mountain Shadow Way
- 7824 House Top Ln
- 60 E 7750 S
- 1 E 775 S
- 273 Big Bear Lane (Lot 11 Wa)
- 273 Big Bear Lane (Lot 11 Wb)
- 7822 Mountain Shadow Way
- 7817 House Top Ln
- 7822 Mountain Shadows Way