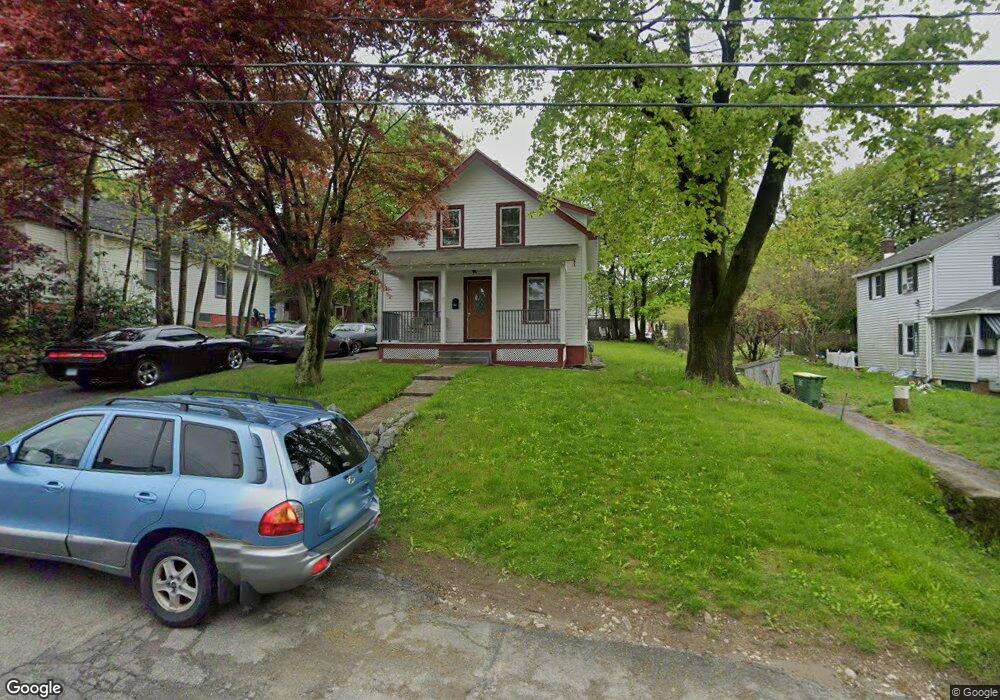
80 Benefit St Waterbury, CT 06704
North End District NeighborhoodEstimated Value: $206,154 - $260,000
2
Beds
1
Bath
966
Sq Ft
$249/Sq Ft
Est. Value
About This Home
This home is located at 80 Benefit St, Waterbury, CT 06704 and is currently estimated at $240,289, approximately $248 per square foot. 80 Benefit St is a home located in New Haven County with nearby schools including Woodrow Wilson School, North End Middle School, and Wilby High School.
Ownership History
Date
Name
Owned For
Owner Type
Purchase Details
Closed on
Aug 21, 2009
Sold by
S & M Equities Inc
Bought by
Matos Pedro
Current Estimated Value
Home Financials for this Owner
Home Financials are based on the most recent Mortgage that was taken out on this home.
Original Mortgage
$127,645
Outstanding Balance
$83,140
Interest Rate
5.19%
Mortgage Type
Purchase Money Mortgage
Estimated Equity
$157,149
Purchase Details
Closed on
Jul 6, 2007
Sold by
Us Bank Na
Bought by
S & M Equities Inc
Purchase Details
Closed on
Jul 5, 2005
Sold by
Nelson David D
Bought by
Nestir Lenise
Home Financials for this Owner
Home Financials are based on the most recent Mortgage that was taken out on this home.
Original Mortgage
$85,000
Interest Rate
5.73%
Mortgage Type
Purchase Money Mortgage
Purchase Details
Closed on
Jun 3, 1999
Sold by
Home Buyers
Bought by
Mcclaren Annette
Purchase Details
Closed on
Jan 29, 1999
Sold by
First Union Natl Bank
Bought by
Home Buyers
Create a Home Valuation Report for This Property
The Home Valuation Report is an in-depth analysis detailing your home's value as well as a comparison with similar homes in the area
Home Values in the Area
Average Home Value in this Area
Purchase History
| Date | Buyer | Sale Price | Title Company |
|---|---|---|---|
| Matos Pedro | $130,000 | -- | |
| S & M Equities Inc | $70,000 | -- | |
| Nestir Lenise | $100,000 | -- | |
| Mcclaren Annette | $88,400 | -- | |
| Home Buyers | $9,900 | -- |
Source: Public Records
Mortgage History
| Date | Status | Borrower | Loan Amount |
|---|---|---|---|
| Open | Home Buyers | $14,950 | |
| Open | Home Buyers | $127,645 | |
| Previous Owner | Home Buyers | $85,000 |
Source: Public Records
Tax History Compared to Growth
Tax History
| Year | Tax Paid | Tax Assessment Tax Assessment Total Assessment is a certain percentage of the fair market value that is determined by local assessors to be the total taxable value of land and additions on the property. | Land | Improvement |
|---|---|---|---|---|
| 2025 | $3,511 | $78,050 | $12,740 | $65,310 |
| 2024 | $3,859 | $78,050 | $12,740 | $65,310 |
| 2023 | $4,230 | $78,050 | $12,740 | $65,310 |
| 2022 | $2,591 | $43,040 | $12,760 | $30,280 |
| 2021 | $2,591 | $43,040 | $12,760 | $30,280 |
| 2020 | $2,591 | $43,040 | $12,760 | $30,280 |
| 2019 | $2,591 | $43,040 | $12,760 | $30,280 |
| 2018 | $2,591 | $43,040 | $12,760 | $30,280 |
| 2017 | $2,820 | $46,840 | $12,750 | $34,090 |
| 2016 | $2,820 | $46,840 | $12,750 | $34,090 |
| 2015 | $2,727 | $46,840 | $12,750 | $34,090 |
| 2014 | $2,727 | $46,840 | $12,750 | $34,090 |
Source: Public Records
Map
Nearby Homes