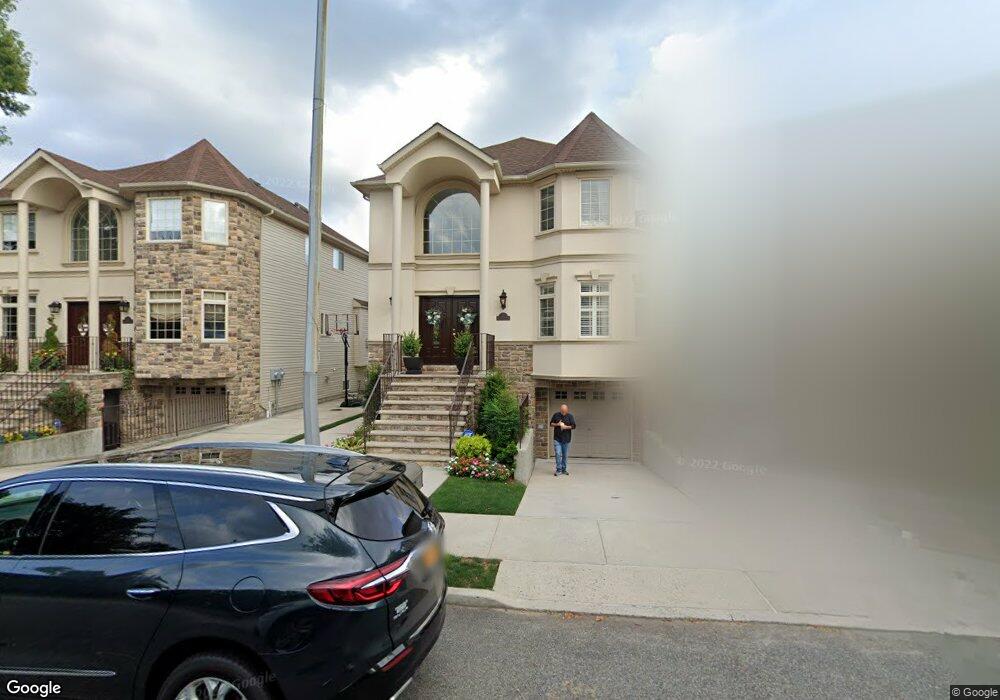
80 Bennett Ave Staten Island, NY 10312
Annadale NeighborhoodEstimated Value: $1,121,984 - $1,380,000
4
Beds
3
Baths
2,476
Sq Ft
$517/Sq Ft
Est. Value
About This Home
This home is located at 80 Bennett Ave, Staten Island, NY 10312 and is currently estimated at $1,279,996, approximately $516 per square foot. 80 Bennett Ave is a home located in Richmond County with nearby schools including P.S. 36 - J.C. Drumgoole, I.S. 007 Elias Bernstein, and Tottenville High School.
Ownership History
Date
Name
Owned For
Owner Type
Purchase Details
Closed on
Mar 7, 2011
Sold by
Bennett Building Corp
Bought by
Reig Clifford and Reig Antoinette
Current Estimated Value
Home Financials for this Owner
Home Financials are based on the most recent Mortgage that was taken out on this home.
Original Mortgage
$460,000
Outstanding Balance
$316,661
Interest Rate
4.83%
Mortgage Type
New Conventional
Estimated Equity
$963,335
Purchase Details
Closed on
Aug 31, 2009
Sold by
Giannola Asaro Rosa Maria and Matarazzo Maryann
Bought by
Lyngstad Earl and Perri Carl
Purchase Details
Closed on
Feb 7, 2008
Sold by
Giannola Salvatore
Bought by
Matarazzo Maryann
Purchase Details
Closed on
Jan 31, 2008
Sold by
Giannola Salvatore and Giannola Maria
Bought by
Giannola Salvatore and Giannola Maria
Create a Home Valuation Report for This Property
The Home Valuation Report is an in-depth analysis detailing your home's value as well as a comparison with similar homes in the area
Home Values in the Area
Average Home Value in this Area
Purchase History
| Date | Buyer | Sale Price | Title Company |
|---|---|---|---|
| Reig Clifford | $745,000 | Stewart Title Insurance Co | |
| Lyngstad Earl | $705,000 | First Amer Title Ins Co Ny | |
| Matarazzo Maryann | -- | None Available | |
| Giannola Salvatore | -- | None Available |
Source: Public Records
Mortgage History
| Date | Status | Borrower | Loan Amount |
|---|---|---|---|
| Open | Reig Clifford | $460,000 |
Source: Public Records
Tax History Compared to Growth
Tax History
| Year | Tax Paid | Tax Assessment Tax Assessment Total Assessment is a certain percentage of the fair market value that is determined by local assessors to be the total taxable value of land and additions on the property. | Land | Improvement |
|---|---|---|---|---|
| 2025 | $9,072 | $65,460 | $7,652 | $57,808 |
| 2024 | $9,084 | $62,100 | $7,919 | $54,181 |
| 2023 | $9,174 | $46,570 | $7,874 | $38,696 |
| 2022 | $8,579 | $53,520 | $10,560 | $42,960 |
| 2021 | $8,515 | $53,640 | $10,560 | $43,080 |
| 2020 | $8,071 | $59,280 | $10,560 | $48,720 |
| 2019 | $7,825 | $63,180 | $10,560 | $52,620 |
| 2018 | $7,613 | $38,808 | $8,952 | $29,856 |
| 2017 | $7,245 | $37,010 | $8,504 | $28,506 |
| 2016 | $6,670 | $34,916 | $9,723 | $25,193 |
| 2015 | $5,901 | $32,940 | $10,560 | $22,380 |
| 2014 | $5,901 | $32,340 | $10,560 | $21,780 |
Source: Public Records
Map
Nearby Homes
- 26 Buffington Ave
- 76 Downes Ave
- 50 Buffington Ave
- 998 Annadale Rd
- 218 Albee Ave
- 163 Bennett Ave
- 164 N Railroad St
- 338 Edgegrove Ave
- 382 Edgegrove Ave
- 172 N Railroad St
- 8 Poillon Ave
- 6 Mosely Ave
- 46 Hillis St
- 274 S Railroad St
- 2 Radnor St
- 4969 Amboy Rd
- 42 Mosely Ave
- 25 Blue Heron Ct
- 267 Bennett Ave
- 50 Poillon Ave
- 82 Bennett Ave
- 78 Bennett Ave
- 86 Bennett Ave
- 90 Bennett Ave
- 39 Tenafly Place
- 41 Tenafly Place
- 35 Tenafly Place
- 66 Bennett Ave
- 89 Bennett Ave
- 17 Hoda Place
- 77 Bennett Ave
- 31 Tenafly Place
- 97 Bennett Ave
- 27 Tenafly Place
- 27 Tenafly Place
- 65 Bennett Ave
- 60 Downes Ave
- 54 Downes Ave
- 23 Tenafly Place
- 109 Bennett Ave