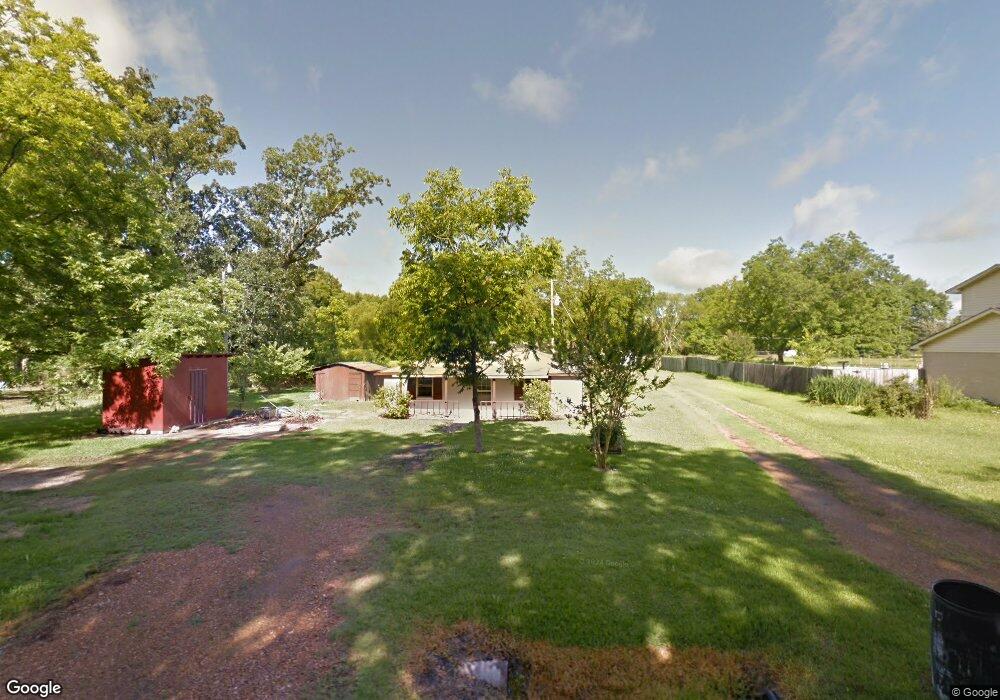
80 Cedar Bluff Loop Cedarbluff, MS 39741
Estimated Value: $52,789 - $179,000
2
Beds
--
Bath
705
Sq Ft
$162/Sq Ft
Est. Value
About This Home
This home is located at 80 Cedar Bluff Loop, Cedarbluff, MS 39741 and is currently estimated at $113,947, approximately $161 per square foot. 80 Cedar Bluff Loop is a home with nearby schools including East Side Elementary School, West Clay Elementary School, and Church Hill Elementary School.
Create a Home Valuation Report for This Property
The Home Valuation Report is an in-depth analysis detailing your home's value as well as a comparison with similar homes in the area
Tax History
| Year | Tax Paid | Tax Assessment Tax Assessment Total Assessment is a certain percentage of the fair market value that is determined by local assessors to be the total taxable value of land and additions on the property. | Land | Improvement |
|---|---|---|---|---|
| 2025 | $169 | $2,998 | $615 | $2,383 |
| 2024 | $169 | $2,998 | $615 | $2,383 |
| 2023 | $284 | $2,554 | $615 | $1,939 |
| 2022 | $142 | $2,554 | $615 | $1,939 |
| 2021 | $142 | $2,554 | $615 | $1,939 |
| 2020 | $143 | $2,554 | $615 | $1,939 |
| 2019 | $133 | $2,536 | $615 | $1,921 |
| 2018 | $127 | $2,536 | $615 | $1,921 |
| 2017 | $127 | $2,536 | $615 | $1,921 |
| 2016 | $125 | $2,536 | $615 | $1,921 |
| 2015 | $122 | $2,388 | $615 | $1,773 |
| 2014 | -- | $2,388 | $615 | $1,773 |
| 2013 | -- | $1,592 | $410 | $1,182 |
Source: Public Records
Map
Nearby Homes
- Highway 50
- Hwy 46
- 18832 Mississippi 50
- 735 Old Highway 10
- 001 Mississippi 46
- 206 Dunnigan Rd
- 0 Mississippi 46
- 00 Highway 50
- 1674 Gin House Rd
- 0 Mississippi 25
- 956 Valley Hills Cir
- 0 Ridgeland Dr
- 0 Valleyhill Cir
- 1103 Steele Rd
- 1288 Steele Rd
- 0 Mississippi 389
- 00 Pheba-Beasley Rd
- 0 Lewis Ln Unit 24219131
- 0 Lewis Ln Unit 4118797
- 0 Lewis Ln Unit 25-1745
- 70 Cedar Bluff Loop
- 829 Cedar Bluff Loop
- 109 Cedar Bluff Loop
- 150 Cedar Bluff Loop
- 125 Cedar Bluff Loop
- 147 Cedar Bluff Loop
- 21 Cedar Bluff Loop
- 176 Cedar Bluff Loop
- 15247 Highway 50 W
- 56 Henryville Rd
- 193 Henryville Rd
- 577 Cedar Bluff Loop
- 194 Cedar Bluff Loop
- 70 Henryville Rd
- 202 Henryville Rd
- 481 Cedar Bluff Loop
- 236 Henryville Rd
- 306 Cedar Bluff Loop
- 270 Cedar Bluff Loop
- 583 Cedar Bluff Loop
Your Personal Tour Guide
Ask me questions while you tour the home.